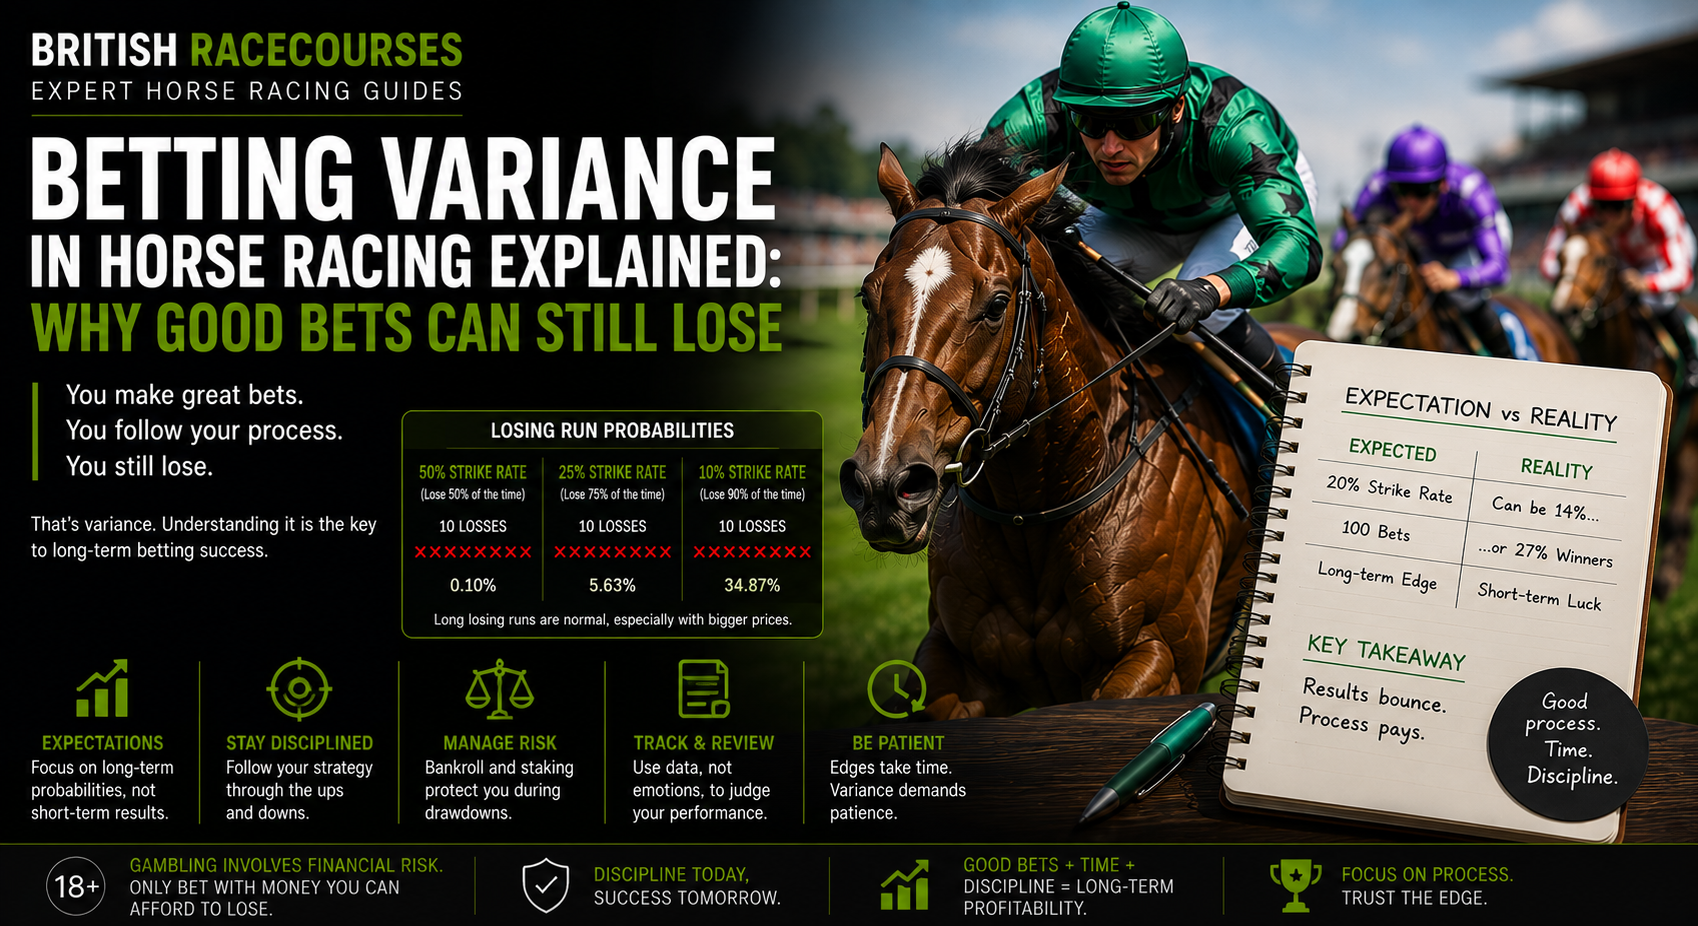
Betting variance explains why you can make good horse racing bets and still lose money over a short period.
It also explains the opposite.
You can make poor betting decisions and still enjoy a winning run.
This is one of the most important ideas to understand after learning about expected value.
Imagine you identify a horse that you believe has a genuine 25% chance of winning.
That means you expect it to win roughly once every four attempts if you could repeat comparable situations many times.
It does not mean:
Win, lose, lose, lose, win, lose, lose, lose.
Real results are much less orderly.
You might experience:
Lose, lose, lose, lose, lose, win, lose, lose, win, lose.
Or:
Win, win, lose, lose, lose, lose, lose, lose, lose, win.
Both sequences can occur even if your original 25% probability estimate is accurate.
That randomness around expected outcomes is variance.
Understanding it matters because without it, bettors can make two costly mistakes:
Abandoning a good strategy because of a losing run.
Or:
Believing a poor strategy works because of a winning run.
This guide explains horse racing betting variance, losing streaks, drawdowns, sample sizes, odds, strike rates and how to distinguish normal short-term fluctuations from evidence that your betting approach may genuinely be wrong.
What Is Variance in Horse Racing Betting?
Variance describes how actual betting results can fluctuate around the results you would expect from the underlying probabilities.
Suppose you place 100 bets on horses that each have a genuine:
20% chance of winning.
You would expect approximately:
20 winners
on average.
But you should not expect exactly 20 winners every time.
One sequence of 100 bets might produce:
14 winners.
Another:
18 winners.
Another:
23 winners.
Another:
27 winners.
The underlying probability can remain the same while the actual results differ.
That difference between expected and realised outcomes is the practical effect of variance.
Expected Results Are Not Guaranteed Results
This distinction is fundamental.
If a horse has a:
20% probability of winning
it does not mean it will win one race out of every five in a neat sequence.
It means that across a very large number of comparable opportunities, you would expect the proportion of winners to move towards 20%.
Small samples can look very different.
This is why analysing betting performance over:
10 bets
or:
20 bets
can be extremely misleading.
Variance vs Expected Value
Variance and expected value are connected, but they describe different things.
Expected value tells you what a bet should theoretically return over repeated opportunities.
Variance tells you how much the actual results can fluctuate around that expectation.
Suppose you believe a horse has a 25% chance of winning.
Fair odds are:
3/1
A bookmaker offers:
5/1
According to your probability assessment, that is a positive expected-value bet.
But the horse still has:
75% chance of losing.
You can therefore make a theoretically excellent bet and lose your entire stake.
Our Expected Value in Horse Racing Betting guide explains the EV side of this relationship.
Variance explains why the expected advantage may take time to appear in actual results.
A Good Bet Can Lose
Suppose your analysis says:
Horse A true probability: 30%
Fair odds:
2.33/1
Available odds:
4/1
If your probability estimate is correct, the bet offers substantial theoretical value.
Horse A loses.
Was it a bad bet?
Not necessarily.
A horse with a 30% chance is still expected to lose:
70% of the time.
The result tells you what happened in one race.
It does not, by itself, tell you whether your decision was correct.
A Bad Bet Can Win
Now reverse the situation.
You believe Horse B has:
20% chance of winning.
Fair odds:
4/1
You back it at:
2/1
The horse wins.
You collect your profit.
Was it a good bet?
According to your own probability assessment, no.
You accepted odds that were substantially shorter than your estimate of the fair price.
The positive outcome does not make the original decision mathematically sound.
This is one reason serious betting analysis separates:
Decision quality
from:
Individual results.
Why Winning and Good Betting Are Not the Same Thing
A bettor can make several poor bets and win.
Another bettor can make several excellent bets and lose.
Over a handful of races, luck can dominate the results.
Over increasingly large samples, the underlying quality of the decisions should become more important.
That is why experienced bettors focus on:
- prices
- probabilities
- expected value
- closing prices
- staking
- long-term records
rather than judging themselves entirely on today’s winners.
Our Closing Line Value in Horse Racing guide provides another way to evaluate price selection independently of whether one particular horse won.
What Is a Betting Losing Run?
A losing run is a sequence of consecutive unsuccessful bets.
For example:
L L L L L W
contains five consecutive losing bets before the winner.
Long losing runs can feel unusual.
Mathematically, they are not necessarily unusual at all.
How frequently they occur depends heavily on your strike rate.
Why Strike Rate Changes Variance
Consider two bettors.
Bettor A
Average winning probability:
50%
Bettor B
Average winning probability:
10%
Bettor B should expect substantially longer losing runs.
That does not automatically make Bettor B’s strategy worse.
Bettor B may be backing much bigger prices.
This is why you cannot assess a betting strategy purely by:
number of winners
or:
length of losing streaks.
The odds profile matters.
Losing Runs at Short Odds
Imagine you regularly back horses with a genuine:
50% winning chance.
Each selection also has a:
50% chance of losing.
The probability of five consecutive losses is:
0.5⁵ = 3.125%
For one specific sequence of five bets, that sounds relatively low.
But if you place hundreds or thousands of bets, you create many opportunities for such sequences to occur.
A losing run that initially appears extraordinary can therefore become perfectly plausible across a long betting history.
Losing Runs at a 25% Strike Rate
Now imagine your selections win:
25% of the time.
They therefore lose:
75% of the time.
Probability of five consecutive losses:
0.75⁵ ≈ 23.7%
Probability of ten consecutive losses:
0.75¹⁰ ≈ 5.6%
Again, those figures relate to a particular block of bets.
Across a much longer sequence, the chance of encountering substantial losing runs increases.
Losing Runs at a 10% Strike Rate
Suppose you specialise in outsiders and your long-term strike rate is:
10%
Each bet therefore has roughly:
90% chance of losing.
Probability of ten specific consecutive losses:
0.9¹⁰ ≈ 34.9%
Probability of twenty:
0.9²⁰ ≈ 12.2%
That is why longshot bettors need to be psychologically and financially prepared for extended losing sequences.
Twenty losers do not automatically prove that a strategy targeting higher-priced horses is broken.
Odds and Variance
As average odds increase, strike rates generally decrease.
Lower strike rates usually mean:
longer losing runs
and:
more volatile returns.
Compare two hypothetical approaches.
| Strategy | Approx. Strike Rate | Typical Odds Profile | Variance |
|---|---|---|---|
| Short-priced selections | 50% | Around Evens | Lower |
| Mid-priced selections | 25% | Around 3/1 | Higher |
| Outsiders | 10% | Around 9/1 | Much higher |
| Big outsiders | 5% | Around 19/1 | Extremely high |
This table does not tell you which strategy is profitable.
It simply illustrates how the experience of betting can differ.
Why Outsider Betting Can Feel Brutal
Suppose you regularly identify genuine value among horses priced between:
10/1 and 25/1.
Even with an edge, most of your bets will lose.
Your betting record may look like:
L L L L L L L W L L L L L L L L L W
That can be perfectly compatible with a profitable long-term approach if the winners arrive often enough and at sufficiently large prices.
This connects directly with Favourite-Longshot Bias in Horse Racing.
Big prices are not automatically good value.
But genuine value at bigger prices naturally produces more volatile results.
Variance Example: 100 Bets at a 20% Strike Rate
Consider a simplified bettor placing:
100 bets
with an underlying average winning probability of:
20%.
The expected number of winners is:
20.
But 20 is not guaranteed.
The bettor might record:
15 winners
and feel their method has failed.
Another 100-bet sequence could produce:
25 winners
and make the same method look exceptional.
Neither short sequence necessarily represents the strategy’s true long-term performance.
This is why sample size matters.
What Is Standard Deviation?
Standard deviation is a statistical measure of how widely results can vary around an expected value.
You do not need to calculate standard deviation before every horse racing bet.
But understanding the principle is useful.
If outcomes have high variance, actual results can move a long way away from expectations over relatively short periods.
Horse racing betting often has substantial variance because:
- every bet can lose
- many selections have relatively low winning probabilities
- prices vary widely
- races contain unpredictable events
- losing sequences can cluster
This makes short-term performance particularly unreliable.
Horse Racing Contains Real-World Uncertainty Too
Not all uncertainty comes from the betting mathematics.
Races themselves contain unpredictable events.
A horse can:
- miss the break
- get boxed in
- jump poorly
- be hampered
- race too keenly
- receive an ineffective ride
- encounter an unexpected pace setup
- lose momentum at a crucial point
Your pre-race analysis may have been perfectly reasonable.
The race can still unfold differently.
That is part of betting uncertainty.
Pace Creates Variance
Imagine your Horse Racing Pace Map suggests there will be one uncontested leader.
You price that horse accordingly.
But another jockey unexpectedly decides to challenge aggressively for the lead.
The entire race shape changes.
Your original analysis may have been logical based on the available evidence.
The realised race was different.
This is why probability-based analysis is more realistic than pretending a predicted race shape is certain.
Draw Can Add Uncertainty
The same applies to Horse Racing Draw.
Historical data might suggest one part of the track is advantageous.
But today’s race may unfold differently because:
- the pace develops elsewhere
- the ground has changed
- rail movements alter the course
- field size differs
- jockeys react tactically
A statistical advantage increases or decreases probability.
It rarely guarantees an outcome.
Sectional Analysis Does Not Remove Variance
Horse Racing Sectional Times can help identify horses whose performances were better than their finishing positions suggest.
That can improve your analysis.
It cannot remove randomness.
A horse identified as undervalued from sectional data can still encounter trouble in its next race.
Better information improves your probability estimates.
It does not turn probabilities into certainties.
What Is a Betting Drawdown?
A drawdown measures the decline from a previous peak in your betting bank.
Suppose your betting bank reaches:
£2,000
It then falls to:
£1,650
before recovering.
Your drawdown is:
£350
or:
17.5%
of the £2,000 peak.
Drawdowns are a normal feature of betting strategies.
The important questions are:
How large can they reasonably become?
and:
Can your betting bank survive them?
Drawdown vs Losing Streak
These terms are related but different.
A losing streak measures consecutive losing bets.
A drawdown measures the decline in your bank from its previous high.
You can experience a substantial drawdown without a huge consecutive losing streak.
For example:
Loss, loss, win, loss, win, loss, loss, win
might contain several winners.
But if the losing stakes exceed the winning returns, the bank can continue falling.
Recovery From Drawdowns
Percentage losses and percentage recoveries are not symmetrical.
Suppose your betting bank falls from:
£1,000 to £800.
That is a:
20% loss.
To return from £800 to £1,000 requires:
25% growth.
A 50% drawdown is even more severe.
£1,000 falling to £500 is:
-50%.
Returning from £500 to £1,000 requires:
+100%.
This is one reason controlling stake size matters so much.
Variance and Your Betting Bank
Your betting bank must be large enough to withstand realistic losing sequences.
If your strategy can naturally produce:
20 consecutive losers
but your staking approach leaves you unable to survive ten, the problem is not necessarily the selections.
The staking structure is unsuitable for the variance of the strategy.
This leads naturally into Horse Racing Bankroll Management.
Why Increasing Stakes After Losses Is Dangerous
Variance creates a strong temptation to chase losses.
Imagine:
Bet 1: £10 lost
Bet 2: £20 lost
Bet 3: £40 lost
Bet 4: £80 lost
Bet 5: £160
The assumption is that a winner will eventually recover everything.
But there is no mathematical rule saying the next selection must win.
A perfectly legitimate losing run can continue.
Increasing stakes aggressively during a drawdown can therefore turn normal variance into a serious financial loss.
You Are Never “Due” a Winner
Suppose you have backed:
15 consecutive losers.
You may feel:
A winner must be coming soon.
That is gambler’s fallacy.
If the next horse independently has:
20% chance of winning
then its chance remains approximately:
20%.
The previous 15 results do not magically make it:
40%
or:
80%.
Your losing history does not alter the horse’s ability.
Winning Runs Can Be Equally Dangerous
Variance works both ways.
Imagine you have:
12 winners from your last 20 bets.
You may start believing:
- your judgement has dramatically improved
- your strategy cannot fail
- you should increase stakes
- you have discovered a major market weakness
Perhaps you have.
But perhaps you have simply experienced an unusually favourable sequence.
Short-term success needs the same scepticism as short-term failure.
Positive Variance
Bettors usually think about variance only when losing.
But positive variance matters just as much.
Suppose your true long-term strike rate is:
20%.
Over 20 bets you happen to land:
eight winners.
That is a 40% observed strike rate.
If you assume 40% is your new normal, you may dramatically overestimate your edge.
Winning runs can therefore encourage poor staking decisions.
Regression Towards the Mean
Regression towards the mean describes the tendency for unusually extreme short-term results to move closer to their underlying average as more observations are collected.
Suppose your genuine long-term strike rate is around:
25%.
After 20 bets you might temporarily record:
45%.
After another period:
15%.
Across hundreds or thousands of comparable bets, the observed figure may move closer to the underlying rate.
This is another reason not to redesign a strategy after every short sequence.
Sample Size Matters
How many bets do you need before judging a strategy?
There is no universal number.
It depends on:
- average odds
- strike rate
- size of the edge
- consistency of the betting method
- race types
- bet types
But one principle is clear:
The smaller the sample, the less confidence you should place in the results.
Twenty bets tell you very little about a strategy with a 10% strike rate.
Even 100 bets can produce substantial noise.
Why 20 Bets Tell You Very Little
Suppose your true strike rate is:
20%.
Expected winners from 20 bets:
4
But you might record:
1 winner
or:
7 winners
without necessarily proving anything dramatic about the underlying method.
If you judge the system purely on those 20 results, you risk confusing variance with skill.
Why 100 Bets Can Still Mislead
One hundred feels like a large number.
In betting analysis, it often isn’t.
This is particularly true when:
- average odds are high
- strike rate is low
- expected edge is small
One or two large-priced winners can transform the profitability of a 100-bet sample.
Remove them and the strategy may appear terrible.
Include them and it may appear exceptional.
Neither necessarily reflects the true long-term expectation.
Why Bigger Odds Require Bigger Samples
Suppose Strategy A backs horses around:
Evens
Strategy B backs horses around:
20/1
Strategy B will need a much larger sample before its observed strike rate becomes stable.
Why?
Because winners occur far less frequently.
A handful of extra 20/1 winners can dramatically change the results.
This is one of the biggest problems when evaluating longshot systems.
Variance and Return on Investment
ROI is calculated as:
Profit ÷ Total Stakes × 100
Suppose two bettors each place 100 £10 bets.
Total stakes:
£1,000
Bettor A makes:
£100
ROI:
+10%
Bettor B loses:
£100
ROI:
-10%
Can you conclude that A has an edge and B does not?
Not necessarily.
Over only 100 bets, variance may explain part or even most of the difference.
ROI becomes more informative as the sample grows and the betting methodology remains consistent.
Variance and Closing Line Value
This is where Closing Line Value becomes particularly useful.
Imagine you have had:
50 bets
and lost money.
But your average selections have consistently shortened after you backed them.
Examples:
10/1 → 7/1
6/1 → 4/1
3/1 → 9/4
You may still have a losing betting record.
But consistently securing stronger prices than the later market provides another piece of evidence about your process.
It does not guarantee future profit.
It does help you avoid evaluating everything through a small sample of race results.
Variance and Expected Value Together
Think of EV and variance as answering two different questions.
Expected Value
Should this type of bet theoretically make money over repeated opportunities?
Variance
How unpredictable might the journey towards that expected result be?
A strategy could have:
positive EV + high variance
or:
positive EV + lower variance.
Both might theoretically be profitable.
Their betting-bank requirements and losing sequences could be completely different.
Example: Two +EV Strategies
Consider two simplified strategies.
Strategy A
Strike rate: 50%
Average winning price: 11/10
Strategy B
Strike rate: 10%
Average winning price: 11/1
Assume both genuinely have positive expected value.
Strategy B is likely to experience far longer losing sequences.
A bettor who does not understand variance might abandon Strategy B during a normal drawdown even if the underlying approach remains sound.
How Price Shopping Can Reduce the Damage
You cannot remove variance.
But you can improve the economics of your bets by consistently taking stronger prices.
Suppose the same horse is available at:
5/1
11/2
6/1
13/2
Taking 13/2 does not make the horse more likely to win.
It does increase your return when it does.
Across a large sample, those improvements matter.
Our Best Horse Racing Betting Sites guide can help when comparing racing bookmakers and their features.
Best Odds Guaranteed and Variance
Best Odds Guaranteed can sometimes improve the settlement price of qualifying bets when the Starting Price is bigger than the eligible early price.
It does not reduce the probability of a losing run.
It can improve the return when a qualifying winner occurs.
Always check the bookmaker’s current terms.
Each-Way Betting and Variance
Each-way betting can alter the return profile.
Instead of relying entirely on the horse winning, part of the stake is settled on whether it places under the bookmaker’s terms.
This can produce more frequent returns.
However:
more frequent returns do not automatically mean better value.
The odds, place fraction and number of places all matter.
Extra Places can change the structure further.
Betting Exchanges and Variance
Betting exchanges do not remove variance either.
Better prices can improve expected returns.
Different bet types can alter the risk profile.
But a horse backed on an exchange still either produces a successful betting outcome or it does not.
If using exchanges, remember to account for commission when evaluating returns.
See our UK Betting Exchange Sites guide for more information.
Why Backtesting Can Look Better Than Reality
Historical testing can be useful.
It can also produce misleading strategies.
Suppose you test hundreds of different rules:
- jockey
- trainer
- draw
- course
- distance
- going
- odds
- month
- field size
Eventually, some combination may show spectacular historical returns purely by chance.
This is sometimes called overfitting.
The more rules you test, the greater the danger of discovering a pattern that describes the past but has little predictive value.
Beware of Tiny Profitable Samples
Imagine a system shows:
+42% ROI
That sounds excellent.
Then you discover it is based on:
31 bets
including:
one 33/1 winner.
Remove that single winner and the entire result changes.
That does not automatically make the system useless.
It does mean the headline ROI should be treated cautiously.
Always inspect what produced the return.
Split Historical and Future Testing
One useful approach is to develop an idea on one dataset and test it on another.
For example:
Development sample: previous seasons
Test sample: later unseen races
If the strategy performs reasonably across both, that provides stronger evidence than repeatedly adjusting rules until historical results look excellent.
It still does not guarantee future success.
But it reduces the risk of fitting your strategy purely to past randomness.
Keep Your Betting Rules Consistent
Variance becomes difficult to analyse if your approach constantly changes.
Suppose your record contains:
- favourites
- 50/1 outsiders
- each-way bets
- accumulators
- tips copied from others
- your own value bets
Your overall ROI tells you relatively little.
You need to categorise bets.
For example:
| Category | Bets | Strike Rate | Average Odds | ROI | Max Drawdown |
|---|---|---|---|---|---|
| Value bets | |||||
| Pace bets | |||||
| Draw bets | |||||
| Short-priced bets | |||||
| Outsiders |
This makes it easier to identify where volatility and performance actually come from.
Record Your Expected Price
When placing a bet, record:
Your fair price
Price taken
Closing price
Result
This gives you far more information than simply:
Won £50
or:
Lost £10.
Our How to Price a Horse Race guide explains how to create your own fair odds.
Don’t Rewrite Your Strategy After Every Losing Week
One of the worst responses to variance is constant strategy switching.
Week 1:
Back value horses.
Week 2:
Value horses lose, so switch to favourites.
Week 3:
Favourites lose, so switch to outsiders.
Week 4:
Outsiders lose, so follow market movers.
You never collect enough consistent data to learn anything.
A strategy should change because the evidence says it should change.
Not simply because you experienced a few losses.
But Don’t Use Variance as an Excuse Either
There is an equally dangerous mistake.
Some bettors blame every loss on:
bad luck
or:
variance.
That prevents genuine analysis.
A losing strategy does not become good merely because you call its losses variance.
You need evidence that your underlying process has merit.
That might include:
- sensible probability estimates
- strong prices
- positive CLV
- stable performance across larger samples
- logical racing analysis
- results that survive out-of-sample testing
Variance explains fluctuations.
It does not excuse bad betting.
How Do You Know Whether It Is Variance or a Bad Strategy?
You can never know with perfect certainty from a small sample.
But ask:
Are You Beating Your Fair Prices?
If not, reconsider your selection criteria.
Are You Beating the Closing Market?
Consistent positive CLV can provide useful evidence.
Is Your Sample Large Enough?
Thirty bets rarely justify sweeping conclusions.
Have Market Conditions Changed?
An old edge may disappear.
Is the Strategy Logically Sound?
There should be a reason the market might be mispricing your selections.
Did You Change the Rules?
If so, historical comparisons may no longer be valid.
Is One Big Winner Distorting Everything?
Check performance with and without extreme results.
Variance and Emotional Betting
Variance is not merely mathematical.
It creates emotional pressure.
During losing runs, bettors may:
- increase stakes
- chase losses
- lower selection standards
- place more bets
- abandon their method
- become obsessed with getting back to even
During winning runs, they may:
- become overconfident
- increase stakes aggressively
- ignore prices
- assume skill explains every win
Both responses can damage an otherwise disciplined approach.
Judge Decisions Before Results
One useful habit is recording your reasoning before the race.
Write:
My fair price: 4/1
Available price: 6/1
Main reason: favourable pace setup
Minimum acceptable price: 11/2
Then watch the race.
This prevents the result from rewriting your memory.
If the horse loses, you can still assess whether the original analysis was reasonable.
Review the Race Properly
Afterwards, ask:
- Did the expected pace develop?
- Did the horse get the anticipated position?
- Was the ground as expected?
- Did the draw matter?
- Did something unexpected occur?
- Would I make the same bet again at the same price?
Our How to Analyse a Horse Race Like a Professional guide provides the broader framework for this type of review.
Variance Checklist
Before judging your results, ask:
☐ How many bets are in the sample?
☐ What is my average price?
☐ What is my strike rate?
☐ What strike rate should I reasonably expect?
☐ How long are my losing runs?
☐ Are those losing runs unusual for my odds profile?
☐ What is my maximum drawdown?
☐ Am I consistently taking strong prices?
☐ What does my closing-line value look like?
☐ Is one large winner distorting the results?
☐ Have I kept my selection rules consistent?
☐ Am I changing strategy because of evidence or emotion?
☐ Is my stake size suitable for the volatility of my bets?
A Better Way to Review 100 Bets
Do not simply calculate:
Profit = +£120
and conclude:
My strategy works.
Instead record:
Number of bets: 100
Total stakes: £1,000
Profit/loss: +£120
ROI: +12%
Strike rate: 22%
Average odds: 5.4
Average fair odds: 4.8
Average closing price: 4.9
Longest losing run: 13
Maximum drawdown: £180
Then ask whether the results are consistent with the original expectations.
This creates a much more useful picture.
Variance by Odds Range
It can also help to divide results by price.
| Odds Range | Bets | Winners | Strike Rate | ROI | Longest Losing Run |
|---|---|---|---|---|---|
| Odds-on | |||||
| Evens to 3/1 | |||||
| Above 3/1 to 8/1 | |||||
| Above 8/1 to 20/1 | |||||
| Above 20/1 |
You may discover that almost all of your volatility comes from one price range.
That is actionable information.
Variance by Bet Type
Do the same for:
- win bets
- each-way bets
- exchange bets
- multiples
And by analytical method:
- pace
- draw
- sectional
- handicap
- trainer
- market
The objective is to understand why your results behave as they do.
Does Variance Eventually Disappear?
No.
Variance never disappears completely.
Even after thousands of bets, future results remain uncertain.
What changes is your ability to estimate the underlying performance of the strategy.
A larger sample generally provides more evidence than a smaller one.
But there is no point where racing becomes certain.
Can You Reduce Variance?
You cannot eliminate it, but you can alter your risk profile.
Potential approaches include:
- smaller stakes
- a larger betting bank
- avoiding excessive concentration
- specialising in shorter-priced selections
- using each-way bets selectively where the terms justify them
- avoiding unnecessary multiples
However, reducing variance is not the same as increasing expected value.
A low-variance strategy can still lose money.
Should You Prefer Low Variance?
Not automatically.
Suppose:
Strategy A: low variance, negative EV
Strategy B: higher variance, positive EV
The smoother-looking Strategy A is not automatically better.
The goal is to understand the relationship between:
edge
risk
and:
bankroll.
That is why variance should be studied alongside EV and staking.
Why Variance Leads Directly to Bankroll Management
Once you accept that even good betting strategies can experience significant drawdowns, another question becomes unavoidable:
How large should your betting bank be?
And then:
How much should you stake on each selection?
A bettor with a genuine edge can still fail if they stake too aggressively.
That makes Horse Racing Bankroll Management the natural next step after variance.
How Betting Variance Fits Into the British Racecourses Analysis Cluster
The process now becomes:
Analyse the race
↓
How to Analyse a Horse Race Like a Professional
↓
Understand form, draw and pace
↓
Horse Racing Pace Maps Explained
↓
Identify hidden performance
↓
Horse Racing Sectional Times Explained
↓
Create fair odds
↓
↓
Understand market bias
↓
Horse Racing Favourite-Longshot Bias Explained
↓
Calculate the theoretical edge
↓
Expected Value in Horse Racing Betting
↓
Compare your price with the market
↓
Closing Line Value in Horse Racing
↓
Understand fluctuations in results
↓
Betting Variance in Horse Racing Explained
↓
Protect your betting capital
↓
Horse Racing Bankroll Management
The pages are intended to answer different questions rather than repeating the same value-betting concept.
Frequently Asked Questions
What is variance in horse racing betting?
Variance describes the fluctuations between expected betting outcomes and the results you actually experience over a particular period.
Can a good betting strategy lose money?
Yes. A strategy with positive expected value can lose over short and sometimes substantial periods because results are uncertain.
Can a bad betting strategy make money?
Yes. Negative-EV betting can still produce profitable short-term runs.
What is a losing run?
A losing run is a sequence of consecutive unsuccessful bets.
Are ten consecutive losing bets unusual?
That depends heavily on the strike rate. Ten losers are much more likely for a strategy with a 10% strike rate than one with a 60% strike rate.
Why do outsider bettors experience longer losing runs?
Higher-priced selections generally win less frequently. Lower strike rates naturally create more opportunities for extended losing sequences.
Does a losing streak mean my strategy has stopped working?
Not necessarily. Compare the run with the strategy’s expected strike rate, average odds, sample size and longer-term performance.
What is drawdown in betting?
Drawdown is the decline in your betting bank from a previous peak.
Is drawdown the same as a losing streak?
No. A losing streak counts consecutive losses. Drawdown measures the decline in the value of your bank.
Why are large drawdowns dangerous?
Large percentage losses require even larger percentage gains to recover.
How many bets do I need before judging a strategy?
There is no universal number. Strategies with low strike rates and high average odds generally require larger samples.
Are 100 bets enough?
Sometimes they provide useful information, but 100 bets can still be heavily influenced by variance, particularly with high-priced selections.
Does variance decrease with more bets?
The influence of random short-term fluctuations becomes easier to assess as the sample grows, but uncertainty never disappears.
Does positive EV guarantee profit?
No. Positive EV describes a theoretical long-term advantage based on your probability estimates. It does not guarantee any particular sequence of results.
What is positive variance?
Positive variance is when actual results are better than the underlying expectation over a period.
Can winning too much be misleading?
Yes. An unusually successful short period can cause you to overestimate your genuine edge.
What is regression towards the mean?
It describes how extreme short-term results can move closer to their underlying average as more observations accumulate.
Can I calculate the probability of losing streaks?
You can estimate the probability of particular sequences using the selection’s loss probability, although calculating the chance of encountering a run somewhere across a long series is more involved.
Does each-way betting reduce variance?
It can create more frequent returns because the place portion can succeed without the horse winning, but the overall value still depends on the price and place terms.
Do betting exchanges reduce variance?
Not inherently. Exchange prices and bet structures can differ, but uncertainty around race outcomes remains.
Does Best Odds Guaranteed reduce variance?
Not directly. BOG can improve eligible settlement prices, but it does not make the horse more likely to win.
What is the biggest mistake bettors make during losing runs?
Increasing stakes aggressively to recover losses can turn an ordinary period of variance into a much larger financial loss.
Should I change my strategy after a losing month?
Not solely because it lost for one month. Review the sample size, prices, CLV, race analysis and whether the underlying assumptions remain valid.
Can variance explain every loss?
No. Variance should never become an excuse for poor selections, bad prices or an ineffective strategy.
How can I tell if I have an edge?
No single metric proves it. Fair-price accuracy, expected value, closing-line performance, logical analysis and sufficiently large betting records can all provide evidence.
Why should I record my fair price?
It lets you assess whether you consistently obtained odds greater than your own estimate of the horse’s true price.
What should I learn after betting variance?
Bankroll management. Once you understand that losing runs and drawdowns are inevitable possibilities, the next question is how to size your betting bank and stakes so normal variance does not cause excessive losses.
Summary
Betting variance explains why short-term results can be deceptive.
You can:
make good bets and lose
and:
make bad bets and win.
That is not a contradiction.
It is a consequence of probability.
If you back horses with a genuine 20% chance of winning, they should lose around 80% of the time.
Those losses will not arrive in a perfectly even pattern.
They can cluster.
You may experience:
five losers
ten losers
or considerably longer losing runs depending on your strike rate and the number of bets you place.
The effect becomes even more pronounced when backing outsiders.
That does not mean you should avoid high-priced horses.
It means your betting bank, staking and expectations need to reflect the volatility of the strategy.
This is why you should avoid judging bets purely by whether they won.
Instead, consider:
Was my probability estimate reasonable?
Did I take a price bigger than my fair odds?
Did I secure a strong price relative to the closing market?
Is my sample large enough to draw conclusions?
Are my results being distorted by one or two unusually large winners?
Is the drawdown consistent with the type of bets I place?
Use Expected Value in Horse Racing Betting to understand the theoretical quality of a bet.
Use How to Price a Horse Race to create your own probability estimates.
Use Closing Line Value in Horse Racing to compare the price you secured with the later market.
Then use variance to put your actual results into context.
A losing week does not prove you are a poor bettor.
A winning week does not prove you have an edge.
The quality of your process has to be judged across enough bets for the underlying signal to begin separating itself from the noise.
18+. Gambling involves financial risk. Only bet with money you can afford to lose.