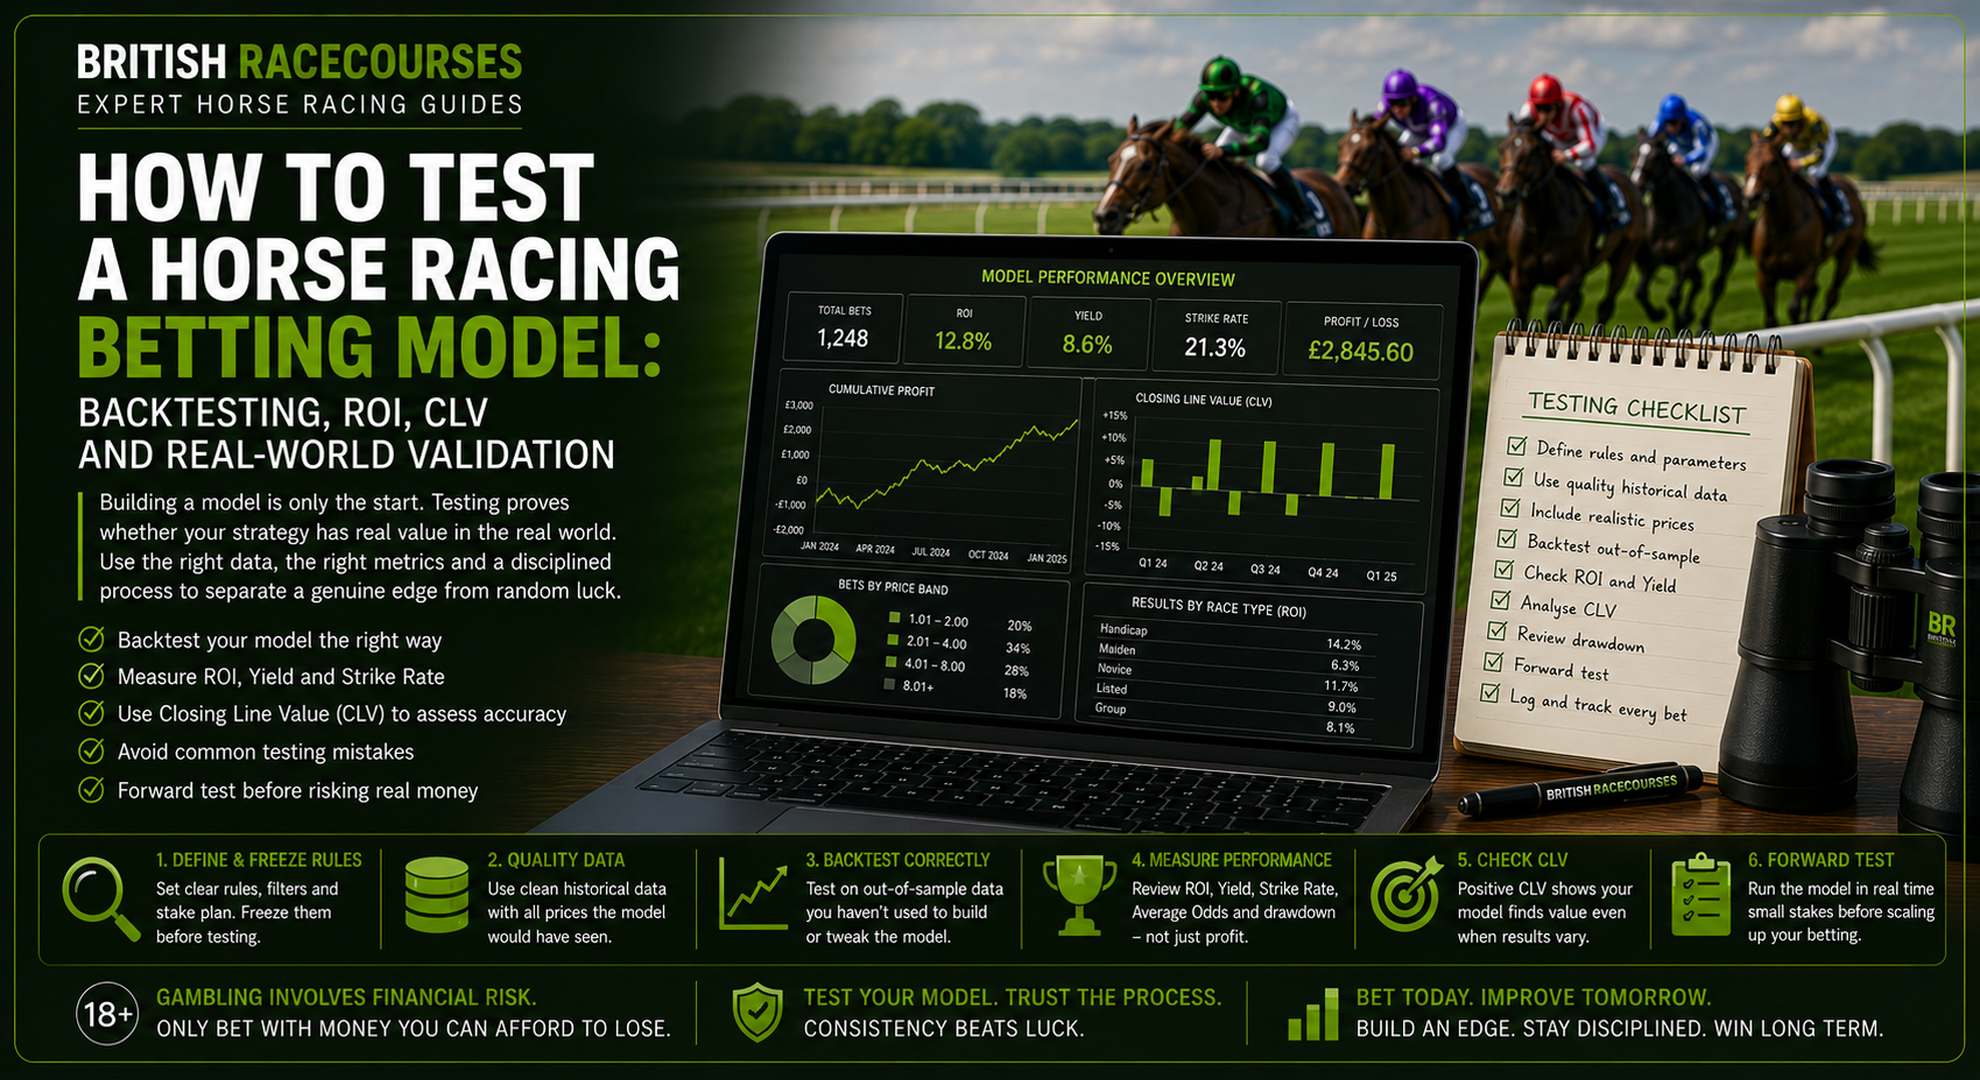
Building a horse racing betting model is only the beginning.
The harder question is:
Does it actually work?
A betting model can look excellent on paper.
It can produce logical ratings.
It can identify winners.
It can even show impressive historical profits.
None of those things automatically proves the model has a genuine edge.
To test a horse racing betting model properly, you need to separate:
prediction
from:
validation.
Validation asks whether the model continues to perform when it encounters races it was not specifically designed around.
That means examining:
- backtesting
- out-of-sample results
- ROI
- yield
- strike rate
- closing line value
- drawdown
- losing runs
- probability calibration
- performance by odds range
- performance by race type
- forward testing
The objective is not to find a model that looks perfect historically.
It is to find evidence that the model may contain a repeatable edge.
If you have not already built your basic framework, start with How to Build Your Own Horse Racing Betting Model.
This page explains what should happen next.
What Does It Mean to Test a Horse Racing Betting Model?
Testing means applying your model to a meaningful sample of races and comparing its predictions with what actually happened.
You want to know:
Did the horses rated highly perform as expected?
Did the prices identified as value produce acceptable returns?
Did the model beat the closing market?
Did it perform on races it had not seen before?
Were the results robust or dependent on one lucky winner?
A good test should challenge the model.
It should not simply confirm what you already want to believe.
The Biggest Testing Mistake
The biggest mistake is building and testing the model on exactly the same data.
Imagine you analyse:
10,000 historical races.
You discover that a particular combination of:
- draw
- pace
- trainer form
- odds
- race class
- field size
would have produced:
+25% ROI.
You then say:
My model has a 25% edge.
Not necessarily.
You may simply have built rules that describe those historical races unusually well.
That is overfitting.
The real test is whether the same approach works on:
new races the model did not use during development.
What Is Backtesting?
Backtesting means applying a betting model or strategy to historical data to see how it would have performed.
Suppose your model generates selections for:
5,000 historical races.
You can then calculate:
- bets
- winners
- average odds
- total stakes
- returns
- profit
- ROI
- maximum drawdown
- longest losing run
This provides a useful first impression.
But backtesting is only useful if it reflects realistic betting conditions.
A Simple Backtesting Example
Imagine your model produced:
1,000 bets
at:
£10 per bet.
Total stakes:
£10,000
Total returns:
£10,850
Profit:
£850
ROI:
8.5%.
That looks encouraging.
But you should not immediately conclude:
The system works.
You now need to ask:
Where did the £850 come from?
Inspect the Profit Distribution
Suppose your £850 profit includes:
one 50/1 winner returning £510 from a £10 stake.
Without that horse:
Profit falls dramatically.
That does not automatically invalidate the model.
But it reveals that a large part of the apparent performance depends on one unusual result.
Now compare another model.
Total profit:
£850
but no single bet contributed more than:
£100.
The second result may be more robust.
Always inspect how profit was generated.
ROI vs Yield
ROI and yield are often used similarly in betting analysis.
A common calculation is:
Profit ÷ Total Stakes × 100
Suppose:
Total stakes:
£5,000
Profit:
£400
Then:
£400 ÷ £5,000 × 100 = 8%
Your betting return relative to stakes is therefore:
8%.
Whether you call this ROI or yield, remain consistent throughout your records.
Why Headline ROI Can Mislead
A strategy showing:
+30% ROI
sounds outstanding.
But imagine:
Bets:
40
Winners:
5
One winner:
40/1
That sample tells you very little.
Now compare:
+6% ROI
over:
4,000 bets
with similar results across several seasons.
The lower percentage may provide much stronger evidence.
Sample size matters enormously.
Strike Rate Matters Too
Suppose a strategy wins:
15%
of its bets.
That is neither good nor bad on its own.
If average odds are:
4/1
a 15% strike rate may be poor.
If average odds are:
10/1
it may be excellent.
Always analyse:
strike rate + average price + return
together.
Average Odds
Record the average odds of your selections.
This helps put losing runs and strike rate into context.
Consider two models.
Model A
Strike rate:
40%
Average odds:
2.20
Model B
Strike rate:
12%
Average odds:
10.50
Their betting records will behave very differently.
Model B should expect much longer losing runs.
That does not automatically make it worse.
Our Betting Variance in Horse Racing guide explains why odds profile and strike rate affect volatility.
Maximum Drawdown
Maximum drawdown measures the largest decline from a previous betting-bank peak.
Suppose your bank grows:
£1,000 → £1,500
then falls to:
£1,050
before recovering.
The drawdown is:
£450
or:
30%
from the £1,500 peak.
A profitable model with extreme drawdowns may be difficult to follow in practice.
That is why final profit alone is insufficient.
Longest Losing Run
Record the longest sequence of losing bets.
Suppose your backtest shows:
24 consecutive losers.
If your staking plan cannot survive:
15 losers
then the model and staking approach are incompatible.
Use Horse Racing Bankroll Management to ensure your bank can withstand the strategy’s realistic volatility.
Do Not Treat Historical Maximums as Limits
If your historical losing run was:
20 bets
that does not mean future losing runs cannot reach:
25
or:
30.
Historical performance provides evidence.
It does not create a guaranteed boundary.
Always allow room for worse future outcomes.
Freeze the Rules Before Testing
This is one of the most valuable habits in model testing.
Before running the test, write down:
- model variables
- weights
- filters
- minimum odds
- maximum odds
- race types
- staking assumptions
- value threshold
Then:
freeze them.
Do not change the rules halfway through because results look disappointing.
If you alter the system after seeing the result, you are no longer testing the original model.
Why Rule Tweaking Creates False Confidence
Imagine your first test loses:
10%.
You notice that:
soft-ground races performed badly.
So you remove them.
Now the model loses:
4%.
You notice:
horses above 20/1 performed badly.
Remove them.
Now:
+3%.
Then remove:
fields above 14 runners.
Now:
+12%.
It can feel like the model is improving.
But you may simply be deleting historical losses until the sample becomes profitable.
That is classic overfitting.
Training Data
Training data is the historical information used to build the model.
For example:
2021 to 2024
You might use those races to determine:
- variable selection
- weights
- filters
- thresholds
Once the model is built, stop adjusting it temporarily.
Then test it elsewhere.
Test Data
Test data should contain races that were not used to build the model.
For example:
Training:
2021 to 2024
Test:
2025
If the model works reasonably on 2025 races without modification, that is much more encouraging than excellent results on the training sample alone.
What Is Out-of-Sample Testing?
Out-of-sample testing means evaluating the model on data it has not previously used.
This is one of the strongest protections against overfitting.
Imagine:
Training ROI:
+18%
Test ROI:
+7%
The lower test return might still be encouraging.
Now imagine:
Training ROI:
+35%
Test ROI:
-14%
That should immediately raise questions about whether the training result was mainly historical fit.
Do Not Keep Looking at the Test Set
A subtle mistake occurs when you:
- Build model on training data.
- Test on 2025.
- Change the model based on 2025 results.
- Test again on 2025.
At that point, 2025 has effectively become additional training data.
You need another unseen sample.
This is why disciplined model development becomes increasingly important.
Rolling Testing
A more realistic approach can use rolling periods.
For example:
Build using:
2021-2023
Test:
2024
Then update using:
2021-2024
Test:
2025
This can help determine whether the relationship remains stable over time.
Time Matters in Horse Racing Models
Racing markets change.
Trainer behaviour changes.
Track characteristics can change.
Betting markets become more efficient.
A model that worked strongly several years ago may weaken.
Always inspect results by period.
For example:
| Period | Bets | ROI |
|---|---|---|
| 2022 | ||
| 2023 | ||
| 2024 | ||
| 2025 | ||
| 2026 |
You want to understand whether performance is:
stable
or:
declining.
Test by Race Type
A model may not work equally well everywhere.
Separate:
- Flat
- jumps
- handicaps
- non-handicaps
- maidens
- novices
- sprints
- staying races
- turf
- all-weather
You may discover:
+10% ROI in Flat handicaps
but:
-8% in novice races.
That can reveal where the model actually has predictive value.
Test by Distance
Distance may matter.
Group results into:
- 5f to 6f
- 7f to 1m
- middle distance
- staying races
A model heavily dependent on pace and draw might perform much better in sprints than in staying contests.
Test by Course
Use course-level analysis cautiously.
Suppose the model performs extremely well at:
Course A
but you only have:
32 bets.
That may be noise.
A broader pattern across similar tracks is often more informative.
British Racecourses’ Racecourse Guides can help identify meaningful course characteristics when reviewing model performance.
Test by Odds Range
This is one of the most useful breakdowns.
| Odds Range | Bets | Strike Rate | ROI | CLV |
|---|---|---|---|---|
| Odds-on | ||||
| Evens to 3/1 | ||||
| Above 3/1 to 8/1 | ||||
| Above 8/1 to 20/1 | ||||
| Above 20/1 |
You might discover your model consistently overestimates outsiders.
That is extremely useful information.
Favourite-Longshot Bias and Testing
Our Horse Racing Favourite-Longshot Bias page explains why different odds ranges can behave differently.
Your model might appear profitable overall while producing:
strong results at 3/1 to 8/1
and:
poor results at 20/1+.
If so, investigate whether your probability estimates are miscalibrated at bigger prices.
Calibration Testing
A probability model should be tested for calibration.
Suppose your model says:
20%
for 500 different horses.
If the model is well calibrated, approximately:
20%
of those runners should win over a sufficiently large sample.
If only:
10%
win, your model is probably overestimating their chances.
Example Calibration Table
| Predicted Probability | Runners | Actual Win Rate |
|---|---|---|
| 5-9.9% | ||
| 10-14.9% | ||
| 15-19.9% | ||
| 20-24.9% | ||
| 25-29.9% | ||
| 30-39.9% | ||
| 40%+ |
You want the actual results to broadly follow the predicted probability bands.
Perfect agreement is unrealistic.
Large consistent gaps matter.
Overconfidence in Models
Many models become overconfident.
They might regularly say:
Horse A:
40%
when horses in that category actually win:
30%
of the time.
That creates two problems.
First:
Your fair odds are too short.
Second:
If you use Kelly Criterion for Horse Racing Betting, your stakes may become too large.
Calibration therefore affects both selection and staking.
Closing Line Value
Closing line value, or CLV, is one of the most useful additional metrics.
Suppose your model says:
Horse A should be 5/1.
You back:
8/1.
The horse eventually starts:
11/2.
You secured a substantially bigger price than the later market.
The bet might still lose.
But the price movement provides useful feedback.
Our Closing Line Value in Horse Racing guide explains this concept in depth.
Why CLV Helps During Losing Runs
Suppose your model has:
100 bets
and shows:
-7% ROI.
But your selections consistently shorten after you back them.
Examples:
12/1 → 8/1
8/1 → 5/1
5/1 → 7/2
This does not prove the model is profitable.
But it may suggest the model is identifying value earlier than the market.
Now imagine:
+5% ROI
but selections repeatedly drift heavily.
That apparent profit may deserve more scrutiny.
CLV Is Not Perfect
Do not treat closing price as absolute truth.
Markets can be wrong.
Liquidity differs.
Prices can move for many reasons.
Still, across sufficiently large samples, CLV can provide another useful signal about price quality.
The best validation rarely relies on one metric.
Profit + Calibration + CLV
A strong testing framework looks for agreement between several indicators.
For example:
Positive out-of-sample ROI
Reasonable probability calibration
Positive average CLV
Manageable drawdown
Stable performance across time
Together, those provide much stronger evidence than:
Backtest profit = £2,000.
Test Realistic Prices
This is essential.
Your historical model might say:
bet Horse A at 8/1.
But was 8/1 actually available when your model would have placed the bet?
If the realistic available price was:
6/1
you cannot simply use 8/1 because it improves the backtest.
Use realistic prices.
Best Price Bias
Another common backtesting mistake is always assuming you received:
the best bookmaker price available all day.
In reality, you may not have:
- had an account there
- seen the price
- placed the bet before it moved
- been able to stake the full amount
A realistic backtest should reflect how the strategy would genuinely operate.
Starting Price vs Available Price
Using Starting Price is convenient.
But if your strategy places bets:
three hours before the race
SP does not represent the price you would have received.
Likewise, using early prices for a strategy intended to bet at the off is inaccurate.
Match the price data to the actual betting process.
Account for Exchange Commission
If your strategy uses betting exchanges, returns should reflect commission where relevant.
Do not calculate backtest profit from raw exchange odds while ignoring the costs that would have applied.
See UK Betting Exchange Sites for more on how exchange betting differs from bookmaker betting.
Non-Runners
Non-runners can alter:
- prices
- field size
- draw dynamics
- each-way places
- race shape
A historical backtest should ideally reflect the race as it existed when your bet would have been placed.
Ignoring non-runner effects can create unrealistic results.
Data Leakage
Data leakage is one of the most serious model-testing errors.
It occurs when the model accidentally uses information that would not have been known at betting time.
Imagine you are modelling bets placed:
the evening before racing.
But your dataset includes:
Starting Price.
That information did not exist yet.
Using it to help create the selection introduces future information into the model.
Historical results may become unrealistically strong.
Common Examples of Data Leakage
Watch for:
- final SP
- post-race ratings
- updated going information
- later non-runners
- closing exchange prices
- final jockey changes
- post-race sectional figures
Always ask:
Would I genuinely have known this when the bet was placed?
If not, exclude it from the prediction inputs.
Overfitting by Filter Mining
Suppose you run:
500 different tests.
Eventually, some will look profitable by chance.
You might discover:
Tuesday handicaps
7f
fields of 9-11
horses aged 4-5
drawn 3-7
made:
+40% ROI.
That does not automatically represent a genuine pattern.
The more combinations you search, the more likely you are to find random historical winners.
Simpler Models Can Be More Robust
A model using:
five meaningful variables
may outperform one using:
50 weak variables
on future races.
Complexity is not the objective.
Predictive usefulness is.
The model-building page explains why every variable should earn its place:
How to Build Your Own Horse Racing Betting Model.
Compare Against a Baseline
Your model needs a benchmark.
One obvious benchmark is:
the market.
Ask:
Does my model outperform the implied market probabilities?
You can also compare against simpler systems such as:
always backing the favourite
or:
a basic ratings-only model.
If your complicated model cannot outperform a simple baseline, the additional complexity may not be adding useful predictive information.
Test Against Margin-Free Market Probabilities
Our Bookmaker Overround Explained article shows how to remove the bookmaker margin.
That gives you a cleaner benchmark.
Compare:
Model probability
with:
margin-free market probability.
Then check which one was better calibrated over time.
Statistical Significance
You do not need a statistics degree to understand the principle.
A small profitable sample might simply be luck.
The more bets you have and the larger the observed edge, the stronger the evidence generally becomes.
Suppose:
20 bets, +20% ROI
This is weak evidence.
Now:
3,000 bets, +8% ROI
with stable performance across multiple periods.
That is much more interesting.
Do Not Worship P-Values
Formal statistical testing can be useful.
But no single statistical threshold proves a betting system will remain profitable.
Markets change.
Models degrade.
Data can contain hidden biases.
Use statistics as part of the evidence rather than as a stamp of certainty.
Forward Testing
Forward testing means running the model on future races without changing it.
This is one of the most valuable stages.
You might:
record every qualifying selection
without betting real money.
Then track:
- model probability
- fair odds
- price available
- closing price
- result
- theoretical profit
This allows you to see whether the model continues to behave as expected in real time.
Paper Testing
Paper testing is useful when:
- the model is new
- the backtest is uncertain
- the sample is small
- the stakes would otherwise be meaningful
You can effectively pretend to place the bets.
Record them exactly as if real money were involved.
Do not retrospectively skip selections that lose.
Forward Test Without Changing Rules
This is crucial.
If every bad week causes a model adjustment, you will never know whether the original strategy had merit.
Set a test period.
For example:
300 bets
or:
three months
depending on frequency.
Then review.
Small-Stakes Live Testing
After paper testing, you may decide to use very small stakes.
For example:
0.1 point
rather than:
1 point.
The objective is not to maximise profit.
It is to test:
- execution
- price availability
- bookmaker access
- emotional discipline
- record keeping
- real-world slippage
There is often a difference between spreadsheet results and actual betting.
Slippage
Slippage is the difference between the price your model expects and the price you actually obtain.
Suppose the model triggers at:
8/1.
By the time you place the bet:
13/2.
That reduction matters.
If this happens repeatedly, your theoretical edge can disappear.
Track:
trigger price
and:
actual price taken.
Model Decay
A successful betting model may weaken over time.
Reasons can include:
- the market adapting
- better public data
- bookmaker model improvements
- race conditions changing
- your original edge becoming widely understood
This is sometimes called model decay.
Do not assume historical profitability lasts forever.
Rolling Performance
Track performance using rolling windows.
For example:
last 100 bets
last 250 bets
last 500 bets
This helps you identify gradual deterioration.
But do not overreact to every short-term fluctuation.
Variance still matters.
What Should Trigger a Model Review?
Possible reasons include:
- sustained negative CLV
- severe calibration deterioration
- large out-of-sample losses
- unexpected drawdowns
- performance collapse in core race types
- significant data-source changes
One bad week should not automatically trigger a rebuild.
Keep a Model Change Log
Record every meaningful change.
For example:
Model v1.0
Form + pace + draw.
Model v1.1
Reduced draw weighting.
Model v1.2
Removed novice races.
Include:
- date
- reason
- expected improvement
Then test whether the change actually helped.
Do Not Merge Results Across Different Model Versions
If Model v1 and Model v2 use different rules, combining their performance can hide what is happening.
Track separately.
Otherwise, you may not know which version created the profit.
Testing by Variable
If possible, measure whether individual components add predictive value.
For example:
Base model:
form + class
Then test:
- pace
Then:
- draw
Then:
- sectional data
If adding pace consistently improves out-of-sample performance, it earns its place.
If adding jockey strike rate makes no improvement, consider removing it.
Ablation Testing
A useful concept is testing the model with one component removed.
Suppose your full model uses:
- form
- pace
- draw
- going
- trainer
Remove trainer.
Performance stays the same.
That suggests trainer may not be contributing much.
Remove pace.
Performance collapses.
Pace may be doing important predictive work.
Testing Manual Adjustments
If you manually adjust model probabilities, test those adjustments separately.
For example:
Base model price:
5/1
Manual pace adjustment:
9/2
Track whether your intervention improved results.
You might discover:
the model performs better without you.
That is valuable information.
Keep a Betting Record
Every model test should maintain a detailed record.
Useful fields include:
| Field | Example |
|---|---|
| Date | 27 Aug 2026 |
| Race | 3:20 |
| Horse | Horse A |
| Model Probability | 24% |
| Fair Odds | 4.17 |
| Odds Taken | 6.00 |
| Closing Odds | 4.80 |
| Stake | 1 pt |
| Result | Lost |
| Profit/Loss | -1 pt |
| Strategy Version | v1.2 |
This creates the raw material needed for proper analysis.
Record Losing Bets Too
This sounds obvious.
In practice, poor records often capture:
memorable winners
more clearly than:
routine losers.
Every bet matters.
Otherwise, your results become biased.
Analyse in Points as Well as Pounds
Suppose your stake size changes over time.
Recording everything only in pounds can make historical comparisons difficult.
Points allow you to compare strategy performance across different bank sizes.
Our Points-Based Betting System page explains how points work.
Benchmark Against Your Fair Odds
Your own price matters too.
Suppose the model says:
4/1
and you consistently obtain:
6/1.
That sounds good.
But if horses priced by your model at 4/1 only win:
10%
of the time, the issue may be your probability estimates.
This is why:
EV + calibration + CLV + results
should be reviewed together.
Testing Expected Value
Our Expected Value in Horse Racing Betting page explains theoretical EV.
During testing, group your bets by estimated EV.
For example:
| Estimated EV | Bets | Actual ROI |
|---|---|---|
| 0-5% | ||
| 5-10% | ||
| 10-20% | ||
| 20%+ |
If your model is useful, stronger estimated edges should eventually produce some relationship with stronger results.
If your supposed:
+30% EV
bets perform terribly over large samples, your edge estimates may be too optimistic.
Test Staking Separately
Do not confuse:
selection quality
with:
staking quality.
First test the model using simple flat stakes.
Then evaluate whether alternative staking such as percentage staking or Kelly Criterion improves the risk-return profile.
This makes it easier to identify whether profits came from:
good selections
or:
aggressive staking.
Flat-Stake Testing First
A useful starting point is:
1 point every qualifying selection.
That makes the model easier to compare.
If the model cannot demonstrate useful performance under simple staking, sophisticated stake sizing may only hide the problem.
Model Testing Checklist
Before testing:
☐ Have I frozen the model rules?
☐ Do I know which data was used to build it?
☐ Have I created a genuinely unseen test sample?
☐ Are historical prices realistic?
☐ Have I excluded future information?
During testing:
☐ Am I recording every qualifying selection?
☐ Am I recording fair odds?
☐ Am I recording actual price taken?
☐ Am I recording closing price?
☐ Am I using consistent stakes?
After testing:
☐ What is ROI?
☐ What is strike rate?
☐ What are average odds?
☐ What is maximum drawdown?
☐ What is longest losing run?
☐ How does performance vary by odds range?
☐ How does it vary by race type?
☐ Are probabilities calibrated?
☐ Am I beating the closing market?
☐ Is one winner distorting the result?
☐ Does performance hold out of sample?
☐ Does it survive forward testing?
A Practical Testing Framework
A simple process could look like this.
Stage 1: Build
Use historical data to construct the model.
Stage 2: Freeze
Stop changing rules.
Stage 3: Backtest
Run the model through historical races.
Stage 4: Diagnose
Analyse:
- ROI
- strike rate
- odds
- drawdown
- losing runs
Stage 5: Test Out of Sample
Use completely unseen races.
Stage 6: Check Calibration
Compare predicted probabilities with actual outcomes.
Stage 7: Measure CLV
Determine whether selections regularly beat later prices.
Stage 8: Forward Test
Run the model in real time without meaningful stakes.
Stage 9: Small-Stake Test
Test real execution.
Stage 10: Review
Decide whether the evidence genuinely supports continued use.
What Would Strong Evidence Look Like?
Imagine:
Backtest:
+9% ROI
Out-of-sample:
+6% ROI
Forward test:
+5% ROI
Positive average CLV.
Probability calibration broadly reasonable.
No single winner dominates total returns.
Results remain positive across several periods.
That would be far more encouraging than:
+40% backtest ROI
followed by:
-20% out-of-sample.
What Would Weak Evidence Look Like?
Be cautious if:
- all profit comes from training data
- one large winner explains most returns
- test performance collapses
- probabilities are badly calibrated
- selections consistently drift
- every losing period leads to rule changes
- the model only works with unrealistic historical prices
- results depend on tiny samples
The model may still contain useful ideas.
But the evidence is not strong enough yet.
Testing Is Designed to Break the Model
This is the right mindset.
Do not ask:
How can I prove my model works?
Ask:
How can I find out where it fails?
If the model survives serious attempts to disprove it, your confidence can increase.
That is much stronger than designing tests that make the historical numbers look attractive.
How Model Testing Fits Into the British Racecourses Analysis Cluster
The process now becomes:
Analyse races
↓
How to Analyse a Horse Race Like a Professional
↓
Understand pace
↓
Horse Racing Pace Maps Explained
↓
Understand draw
↓
↓
Use sectionals
↓
Horse Racing Sectional Times Explained
↓
Create fair prices
↓
↓
Understand bookmaker margin
↓
↓
Identify value
↓
How to Find Value Bets in Horse Racing
↓
Calculate expected value
↓
Expected Value in Horse Racing Betting
↓
Measure market movement
↓
Closing Line Value in Horse Racing
↓
Understand variance
↓
Betting Variance in Horse Racing
↓
Manage the bank
↓
Horse Racing Bankroll Management
↓
Calculate stakes
↓
Kelly Criterion for Horse Racing Betting
↓
Build the model
↓
How to Build Your Own Horse Racing Betting Model
↓
Test the model
↓
How to Test a Horse Racing Betting Model
This page therefore performs a different role from the model-building article.
One shows you how to create the process.
This one asks whether the process deserves to be trusted.
Frequently Asked Questions
What is backtesting in horse racing betting?
Backtesting means applying a betting model or strategy to historical races to estimate how it would have performed.
Does a profitable backtest prove a betting model works?
No. Historical profitability can result from overfitting, random variance, unrealistic prices or data leakage.
What is out-of-sample testing?
It means testing the model on races that were not used to build or optimise it.
Why is out-of-sample testing important?
It helps determine whether the model can generalise beyond the historical races used during development.
What is overfitting?
Overfitting occurs when a model becomes too closely tailored to historical data and performs poorly on new races.
What is data leakage?
Data leakage occurs when information unavailable at betting time accidentally enters the model.
What ROI should a horse racing model achieve?
There is no universal figure. Sample size, odds, variance and consistency matter more than one headline percentage.
Is 5% ROI good?
A genuine 5% return over a large, robust sample could be meaningful. A 5% return over 20 bets tells you very little.
What is yield in betting?
Yield commonly measures profit as a percentage of total stakes.
Should I track strike rate?
Yes, but always interpret strike rate alongside average odds.
What is maximum drawdown?
Maximum drawdown is the largest decline from a previous peak in the betting bank.
Why should I track losing runs?
They help you understand the volatility of the strategy and whether your betting bank can withstand realistic bad periods.
What is CLV?
Closing line value compares the odds you take with a later or closing market price.
Does positive CLV prove a model is profitable?
No, but consistent positive CLV can provide useful evidence that your model is identifying favourable prices.
What is probability calibration?
Calibration compares the probabilities predicted by your model with actual win rates across large groups of similar predictions.
How do I know if my model is overconfident?
If selections given a certain probability consistently win less often than predicted, the model may be overestimating their chances.
Should I use the same data to build and test my model?
No. Keep genuinely unseen data for testing.
How many bets are enough to test a model?
There is no fixed number. Higher-priced and lower-strike-rate strategies generally require larger samples.
Are 100 bets enough?
They can provide useful early information, but 100 bets can still be dominated by variance.
Should I test by odds range?
Yes. This can reveal whether your model works better at some prices than others.
Should I test by race type?
Yes. A model may perform well in one category and poorly in another.
Can one big-priced winner distort the results?
Yes. Always inspect how much total profit depends on unusual individual winners.
What is forward testing?
Forward testing means running the frozen model on future races and recording results in real time.
Should I use real money during forward testing?
You can paper-test first. If you later use money, small stakes can help test execution without creating large financial exposure.
What is slippage?
Slippage is the difference between the price expected by the model and the price you actually obtain.
Can a model stop working?
Yes. Market behaviour, data and racing conditions can change over time.
How often should I review my model?
Use a predetermined schedule or sample size rather than constantly changing it after short losing runs.
Should I change my model when it loses?
Only when sufficient evidence suggests a genuine problem. Normal variance can create losing periods even in a useful model.
Should I use Kelly staking when testing?
Flat stakes are often easier for initial validation. Kelly can be assessed separately once you have stronger confidence in the probabilities.
What is the best way to know whether a model has an edge?
No single measure proves it. Stronger evidence comes from a combination of out-of-sample profit, calibration, CLV, manageable drawdown, realistic prices and successful forward testing.
Summary
Building a betting model is easy compared with proving that it works.
Historical profit alone is not enough.
A strong testing process should ask:
Was the model tested on races it had not seen before?
Were the odds realistic?
Was future information accidentally included?
Did one unusual winner create most of the profit?
Are probabilities calibrated?
Does the model beat the closing market?
How severe are drawdowns?
Does performance hold across different periods and race types?
The most important principle is:
Freeze the rules before testing.
Build the model on one sample.
Test it on another.
Then forward-test it in real time.
Measure:
- ROI
- yield
- strike rate
- average odds
- maximum drawdown
- longest losing run
- probability calibration
- closing line value
Do not continually change filters until historical profit looks attractive.
That produces a model designed to explain the past rather than predict the future.
Use How to Build Your Own Horse Racing Betting Model to create the framework.
Use Bookmaker Overround Explained to understand the market probabilities you are testing against.
Use Expected Value in Horse Racing Betting to quantify your estimated edge.
Use Closing Line Value in Horse Racing to assess the prices you obtain.
And use Betting Variance in Horse Racing before interpreting short-term results.
A useful horse racing betting model should not merely survive a friendly backtest.
It should survive attempts to prove it wrong.
That is when historical performance begins to become meaningful evidence rather than just an attractive spreadsheet.
18+. Gambling involves financial risk. Only bet with money you can afford to lose.