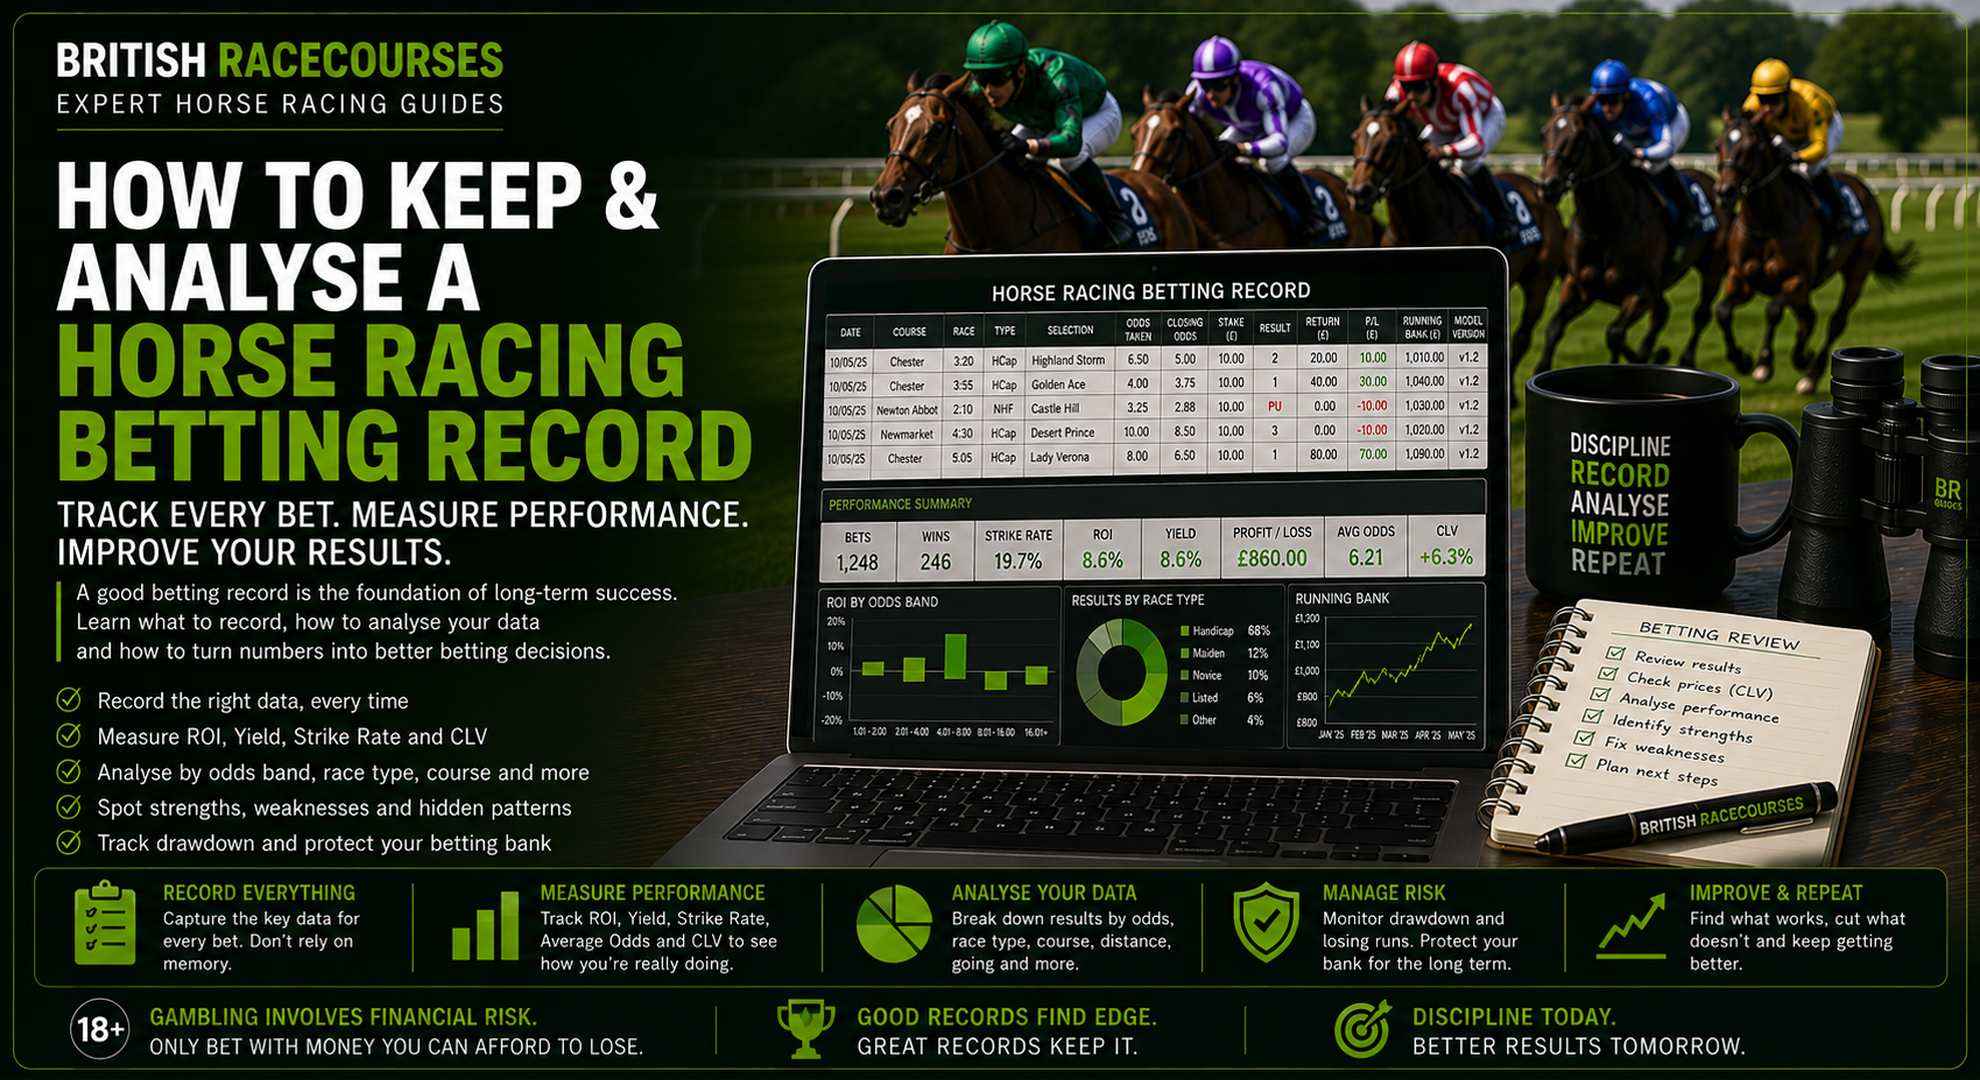
Keeping an accurate horse racing betting record is one of the simplest ways to improve the quality of your betting decisions.
Without records, it is easy to remember:
big winners
and forget:
routine losers.
You might believe you perform particularly well:
- at certain racecourses
- in handicaps
- with outsiders
- on the Flat
- over jumps
- at particular odds
But memory is unreliable.
A proper betting record replaces assumptions with evidence.
It can tell you:
How much have I actually won or lost?
What is my ROI?
What is my strike rate?
Am I obtaining good prices?
Which types of races suit my approach?
Where am I consistently losing money?
How severe are my losing runs?
Is my betting improving?
For more advanced bettors, records can also measure:
- closing line value
- expected value
- model probabilities
- fair odds
- drawdown
- performance by strategy
- performance by model version
The objective is not to create the most complicated spreadsheet possible.
It is to record enough information to make better decisions.
Why Keep a Horse Racing Betting Record?
Every bet creates information.
If you do not record that information, most of it disappears.
Imagine you place:
500 bets
during a year.
Without proper records, you may remember:
a 20/1 winner at a major meeting
a terrible losing Saturday
a horse that was beaten in a photo
Those memorable moments can distort your assessment of your overall performance.
A betting record shows what actually happened across all:
500 bets.
That is much more useful.
Betting Records Remove Guesswork
Suppose you believe:
I am good at betting in handicaps.
Your records might show:
Handicaps:
+7% ROI
Non-handicaps:
-12% ROI
That provides evidence supporting your impression.
But your records might reveal the opposite.
Without data, both conclusions are simply opinions.
Records Help Separate Decisions From Results
A winning bet is not automatically a good bet.
A losing bet is not automatically a bad bet.
Suppose you back:
Horse A at 10/1.
It starts:
6/1
and finishes second.
Result:
Loss.
But you obtained a considerably stronger price than the later market.
Now suppose you back:
Horse B at 3/1.
It drifts to:
7/1
and wins.
Result:
Profit.
The second bet made money.
But that does not necessarily mean the decision-making process was stronger.
A good betting record allows you to examine:
price quality
as well as:
financial outcome.
What Should You Record for Every Horse Racing Bet?
At minimum, record:
- date
- race
- selection
- odds
- stake
- result
- return
- profit or loss
That is enough to create a basic betting record.
For meaningful analysis, however, I would go further.
Recommended Horse Racing Betting Record
A useful structure is:
| Field | Example |
|---|---|
| Date | 28/08/2026 |
| Course | Example Course |
| Race Time | 15:20 |
| Race Type | Flat Handicap |
| Distance | 1m |
| Selection | Horse A |
| Bet Type | Win |
| Odds Taken | 7.00 |
| Closing Odds | 5.50 |
| Stake | 1 point |
| Result | Lost |
| Return | 0 |
| Profit/Loss | -1 point |
| Running Bank | 98 points |
| Strategy | Value Model |
| Model Version | v1.2 |
Advanced bettors can then add:
| Field | Example |
|---|---|
| Model Probability | 20% |
| Fair Odds | 5.00 |
| Market Implied Probability | 14.29% |
| Estimated EV | +40% |
| Going | Good |
| Field Size | 12 |
| Draw | 4 |
| Starting Price | 9/2 |
| CLV | Positive |
You do not need every field.
Record information that you are actually going to analyse.
Date
Always record the date.
This allows you to measure:
- weekly performance
- monthly performance
- annual performance
- rolling results
It can also help identify whether your strategy is improving or deteriorating.
Racecourse
Record the course.
Over time, you can investigate whether your approach performs differently at particular tracks.
Be careful with small samples.
If you have:
8 bets
at one racecourse and:
+60% ROI
that tells you very little.
If you have:
400 bets
across similar tracks and find a persistent pattern, that becomes more interesting.
Our UK Racecourses section can help when researching individual course characteristics.
Race Type
This is particularly useful.
Possible categories include:
- Flat handicap
- Flat non-handicap
- maiden
- novice
- Group race
- Listed race
- hurdle
- chase
- National Hunt Flat race
You may discover that your analysis works well in some races but poorly in others.
Distance
Distance can help reveal whether your approach is suited to:
sprints
or:
staying races.
This is particularly relevant if your analysis places significant emphasis on pace.
A model using Horse Racing Pace Maps might produce different results over:
5 furlongs
than:
2 miles.
Selection
Record the horse.
This sounds obvious, but consistent records matter.
Avoid different abbreviations or naming conventions that make later analysis unnecessarily difficult.
Bet Type
Record whether the bet was:
- win
- each-way
- place
- lay
- other
Do not mix different bet types together without being able to separate them later.
A profitable win strategy can be hidden by poor each-way betting and vice versa.
Odds Taken
This is one of the most important fields.
Record the actual price you received.
Not:
the best price you saw.
Not:
the Starting Price.
Not:
the price available later.
Record:
your actual odds.
If you took:
8/1
record:
8/1
or preferably:
9.00 decimal
if you plan to perform calculations.
Why Decimal Odds Make Analysis Easier
Decimal odds simplify spreadsheet calculations.
For example:
4/1 = 5.00
9/2 = 5.50
10/1 = 11.00
You can then calculate implied probability using:
1 ÷ decimal odds × 100.
Our Betting Odds Explained page covers odds formats in more detail.
Closing Odds
For more advanced analysis, record the closing price or a consistent later-market benchmark.
Suppose you take:
10.00
and the horse later closes:
7.00.
You obtained a larger price than the later market.
If that happens consistently, it can provide useful information about your betting decisions.
See Closing Line Value in Horse Racing for a detailed explanation.
Stake
Record the amount staked.
If you use pounds:
£10
If you use points:
1 point
For strategy analysis, points can make comparisons easier because your betting bank may change over time.
Our Points-Based Betting System explains this approach.
Result
Use consistent result categories.
For example:
Win
Loss
Void
You may also need specific treatment for:
- dead heats
- each-way returns
- Rule 4 deductions
- exchange bets
Consistency makes later calculations easier.
Return
Return means the total amount received back from the bet.
If you stake:
£10
at:
5.00
and win:
Return:
£50
Profit:
£40.
Do not confuse return with profit.
Profit and Loss
Record the net result.
For a £10 losing bet:
-£10
For a £10 bet at decimal odds of 5.00:
+£40 profit
if it wins.
This becomes the basis of most performance calculations.
Running Betting Bank
A running bank shows how your capital changes over time.
Suppose you start:
£1,000
Then:
Bet 1:
-£10
Bank:
£990
Bet 2:
+£40
Bank:
£1,030
Bet 3:
-£10
Bank:
£1,020
Tracking the bank helps visualise:
- growth
- decline
- drawdown
- volatility
Read Horse Racing Bankroll Management before deciding how much of your bank to risk.
Strategy
If you use several approaches, label every bet.
For example:
Pace
Draw
Value
Sectionals
Model
Manual
This allows you to determine which approaches are actually producing results.
Model Version
Anyone using a betting model should record the model version.
For example:
v1.0
v1.1
v2.0
If you change the model, you can then compare performance before and after the change.
This is particularly important when following the process in How to Test a Horse Racing Betting Model.
Model Probability
If you create your own prices, record your estimated probability.
For example:
Horse A = 25%.
This allows you to test whether your probabilities are properly calibrated.
Fair Odds
Convert your probability into fair odds.
If your probability is:
25%
fair decimal odds are:
4.00.
If the bookmaker offers:
5.00
you have identified a potential difference between:
your fair price
and:
the available price.
Our How to Price a Horse Race page explains this process.
Estimated Expected Value
You can also record estimated EV.
Suppose:
Your probability:
25%
Available odds:
5.00
Expected return per £1:
0.25 × £5 = £1.25
Estimated expected profit:
£0.25
Estimated EV:
+25%.
Read Expected Value in Horse Racing Betting for the complete calculation.
Do Not Record Data You Will Never Use
It is easy to create a spreadsheet with:
40 columns.
That does not automatically make it better.
Ask:
Will I analyse this information?
If not, consider leaving it out.
A record you consistently maintain is better than an elaborate system you abandon after two weeks.
How to Analyse Your Horse Racing Betting Record
Recording bets is only the first step.
The value comes from analysing them.
Start with the basic numbers.
Total Bets
How many bets have you placed?
Sample size provides context for everything else.
Results over:
30 bets
should be interpreted very differently from:
3,000 bets.
Total Stakes
Add all stakes.
Suppose:
500 bets
at:
£10 each.
Total stakes:
£5,000.
This figure is required when calculating ROI or yield.
Total Returns
Add the amount returned from every bet.
Suppose:
Total stakes:
£5,000
Total returns:
£5,400
Profit:
£400.
Total Profit or Loss
Calculate:
Total Returns – Total Stakes
In the example:
£5,400 – £5,000 = £400 profit.
This tells you the financial outcome.
But it does not tell you whether the strategy is good.
You need more information.
ROI
A common betting ROI calculation is:
Profit ÷ Total Stakes × 100
Using:
Profit:
£400
Stakes:
£5,000
ROI:
8%.
An 8% historical ROI does not mean you will make 8% in the future.
It describes what happened in the recorded sample.
Yield
Betting yield is commonly calculated in the same way:
Profit ÷ Total Stakes × 100
Different bettors sometimes use terminology differently.
The important thing is to define your calculation and remain consistent.
Strike Rate
Strike rate measures the percentage of bets that win.
Suppose:
Bets:
500
Winners:
100
Strike rate:
20%.
Calculate:
100 ÷ 500 × 100 = 20%.
Strike Rate Without Odds Is Misleading
A:
50% strike rate
is not automatically better than:
15%.
If the 50% strategy backs:
1.50 shots
and the 15% strategy backs:
10.00 shots
their economics are completely different.
Always combine strike rate with average odds and profitability.
Average Odds
Track average odds.
This helps you understand:
- expected strike rate
- losing runs
- volatility
- strategy profile
A bettor regularly backing:
2/1 shots
will experience different results from one backing:
20/1 outsiders.
Profit by Odds Range
This is one of the most useful analyses.
Create groups such as:
| Odds Range | Bets | Winners | ROI |
|---|---|---|---|
| Below 2.00 | |||
| 2.00-3.99 | |||
| 4.00-7.99 | |||
| 8.00-14.99 | |||
| 15.00+ |
You might discover:
strong performance from 4.00-8.00
but:
heavy losses above 15.00.
That gives you something meaningful to investigate.
Favourite-Longshot Bias
If your results deteriorate dramatically at bigger prices, consider whether you are overestimating outsiders.
Our Favourite-Longshot Bias in Horse Racing page explains why odds bands deserve separate analysis.
Profit by Race Type
Break results down into:
Handicaps
Non-handicaps
Maidens
Novices
Group races
Chases
Hurdles
You may discover your approach is much stronger in one area.
Do not immediately change your strategy after finding a pattern.
First check:
sample size.
Profit by Flat vs Jumps
Separating Flat and National Hunt results can reveal major differences.
The two codes involve different:
- race dynamics
- distances
- surfaces
- variables
- sources of uncertainty
A single model may not perform equally well in both.
Profit by Distance
Group results by distance.
For Flat racing, you might use:
5f-6f
7f-1m
above 1m to 1m4f
above 1m4f
Different approaches may perform differently across those categories.
Profit by Going
You can also analyse:
- Firm
- Good to Firm
- Good
- Good to Soft
- Soft
- Heavy
Be cautious because going descriptions are not perfectly uniform and samples can quickly become small.
Profit by Course
Course analysis can be valuable when your betting approach depends on:
- draw
- pace
- track configuration
- surface
But avoid concluding:
I am brilliant at Course X
after 15 bets.
Look for persistent patterns supported by meaningful samples.
Analyse Draw-Based Bets
If draw plays a role in your selections, record the stall and analyse performance.
Our Horse Racing Draw guide explains why the impact of stall position varies by course, distance and conditions.
Your records can reveal whether your draw adjustments actually improve your betting.
Analyse Pace-Based Bets
The same principle applies to pace.
If you identify:
front runners
prominent racers
hold-up horses
record the classification.
Then test whether your Horse Racing Pace Analysis is translating into better betting decisions.
Analyse Sectional-Based Bets
If Sectional Times influence your selections, tag those bets.
You can then determine whether sectional analysis is adding measurable value rather than simply producing interesting observations.
Analyse Closing Line Value
CLV deserves particular attention.
Group bets into:
Positive CLV
Neutral
Negative CLV
Then compare results.
Suppose:
Positive CLV bets:
+8% ROI
Negative CLV bets:
-10% ROI
That is interesting.
But even before enough bets exist to evaluate financial returns, consistent positive CLV can provide useful feedback about the prices you are taking.
Price Taken vs Starting Price
Another simple comparison is:
Odds Taken
against:
Starting Price.
For example:
Taken:
10/1
SP:
6/1
or:
Taken:
4/1
SP:
8/1.
Repeatedly beating SP can be informative.
Repeatedly taking prices that later drift significantly deserves investigation.
Do Not Judge Individual Bets by CLV
One horse drifting does not make the bet bad.
One horse shortening does not make it good.
Look at:
large groups of bets.
The signal becomes more meaningful across repeated decisions.
Analyse Estimated EV
If you record expected value, group bets by your estimated edge.
For example:
| Estimated EV | Bets | Actual ROI |
|---|---|---|
| 0-5% | ||
| 5-10% | ||
| 10-20% | ||
| 20%+ |
Ideally, stronger estimated value should show some relationship with stronger actual results over sufficiently large samples.
If your supposed:
+30% EV
bets consistently perform badly, your probability estimates may be too aggressive.
Analyse Probability Calibration
Suppose you give:
200 horses
a:
25% probability.
Approximately:
50
would be expected to win if your probabilities were perfectly calibrated.
If only:
25
win, your model is likely overestimating their chances.
Calibration testing is covered in more detail in How to Test a Horse Racing Betting Model.
Monthly Performance
Track performance by month.
For example:
| Month | Bets | P/L | ROI |
|---|---|---|---|
| January | |||
| February | |||
| March | |||
| April |
Do not assume one losing month means the strategy has failed.
But monthly analysis can reveal:
- deterioration
- seasonality
- unusually volatile periods
Rolling Performance
Rolling results can be more useful than calendar months.
Consider:
last 100 bets
last 250 bets
last 500 bets.
This helps show whether recent performance is changing without treating arbitrary month-end dates as important.
Maximum Drawdown
Profit alone hides risk.
Suppose your bank starts:
£1,000
rises to:
£1,500
then falls to:
£1,050.
Drawdown:
£450
from the previous peak.
Percentage drawdown:
30%.
That matters.
Could you continue following the strategy after losing 30% from the peak?
Longest Losing Run
Record your longest sequence of losses.
A strategy might be profitable overall but experience:
20
30
or:
40
consecutive losing bets.
This becomes especially important at larger average odds.
Read Betting Variance in Horse Racing before assuming a losing run proves your approach has stopped working.
Largest Winner
Record the largest individual winning contribution.
Suppose total strategy profit is:
+100 points.
One bet produced:
+60 points.
Without that winner:
+40 points.
That does not invalidate the result.
But it tells you that profit is concentrated.
Profit Without the Biggest Winners
Try removing:
the biggest winner
and then:
the five biggest winners.
Ask:
What happens to the record?
A strategy can legitimately rely on occasional large-priced winners.
But you should understand that dependency.
Largest Losing Period
Look beyond individual losing bets.
Find the worst:
week
month
100-bet sequence
or:
drawdown period.
This helps set realistic expectations.
Compare Strategies
Suppose you use three methods.
Strategy A: Pace
500 bets
ROI:
+7%
Strategy B: Draw
400 bets
ROI:
+4%
Strategy C: Trainer Form
600 bets
ROI:
-9%
That immediately gives you something to investigate.
Perhaps trainer form is being overweighted.
Perhaps the bets occur at poor prices.
The record tells you where to look.
Compare Model Versions
Suppose:
Model v1:
1,000 bets, +3% ROI
Model v2:
800 bets, +8% ROI
That looks promising.
But also compare:
- CLV
- drawdown
- calibration
- average odds
- race mix
Do not judge model improvements solely by profit.
Analyse Your Own Overrides
This is particularly revealing.
Suppose your model generates a bet.
You decide:
I don’t fancy it.
So you skip it.
Or your model rejects a horse, but you bet manually anyway.
Tag those decisions.
After several hundred examples, compare:
Model selections
against:
Manual overrides.
You may discover that your judgement adds value.
You may also discover that interfering with the system costs money.
Both results are useful.
Record Reasons for Bets Carefully
Some bettors like adding notes.
For example:
Pace advantage
Strong draw
Hidden sectional
Class drop
Price too big
This can be valuable.
But avoid writing vague retrospective explanations after the result.
Record the reason:
before the race.
That prevents hindsight bias.
Hindsight Bias
After a horse loses, explanations seem obvious.
You may think:
I should have realised the ground was unsuitable.
After it wins:
The pace setup was obvious.
Record your reasoning before the race.
Then compare it with what actually happened.
This creates much more honest feedback.
Do Not Delete Embarrassing Bets
Everyone makes poor decisions.
Do not remove:
- impulsive bets
- chasing bets
- mistakes
- accidental over-staking
from your record because they were not part of the “proper strategy”.
If real money was risked, record it.
Otherwise, your overall betting record becomes artificially flattering.
Separate Strategy Bets From Other Bets
Instead of deleting them, classify them.
For example:
Model
Value
Recreational
Festival
Impulse
You might discover something uncomfortable but valuable.
Your structured strategy may be profitable while your unplanned betting gives the profit back.
That is exactly the sort of information a betting record should reveal.
Keep Deposits and Withdrawals Separate
Depositing money into a bookmaker account is not:
a betting loss.
Withdrawing money is not:
betting profit.
Track:
betting performance
separately from:
cash movements.
Otherwise, your numbers become misleading.
Compare Bookmaker Performance Carefully
You can record the bookmaker used for each bet.
This can help analyse:
- prices obtained
- promotions
- Best Odds Guaranteed
- execution
But do not conclude that one bookmaker is “luckier”.
The race result is not affected by which operator accepted your bet.
The meaningful comparison concerns:
price and terms.
Our Best Horse Racing Betting Sites page covers the wider factors involved in bookmaker comparison.
Record Best Odds Guaranteed Where Relevant
If a winning bet settles at a better SP because Best Odds Guaranteed applied, your actual return should reflect that.
You may also want to record:
original odds taken
and:
settlement odds
separately.
This keeps your price analysis accurate.
Each-Way Records
Each-way bets need slightly more detail.
Consider recording:
- win odds
- stake per part
- place fraction
- number of places
- total stake
- win return
- place return
This becomes especially important when comparing Extra Places offers.
Betting Exchange Records
For exchange betting, record:
- back or lay
- requested odds
- matched odds
- stake
- commission
- net profit/loss
Do not calculate performance from gross returns if commission reduces the actual amount received.
See UK Betting Exchange Sites for more information.
Creating a Horse Racing Betting Spreadsheet
A spreadsheet is usually sufficient for most bettors.
You can use columns for:
Date
Course
Race
Selection
Odds
Stake
Result
Return
Profit/Loss
Then add more advanced columns when required.
Basic Spreadsheet Formulas
Suppose:
Odds are in:
Column H
Stake:
Column I
Result:
Column J
You can calculate returns according to your spreadsheet structure.
The precise formula depends on how you record:
- wins
- losses
- void bets
- each-way bets
Keep the structure simple enough that you understand every calculation.
Automatic Running Bank
Your spreadsheet can calculate:
Previous Bank + Current Profit/Loss
for each new bet.
This creates a running equity curve.
Plotting that bank over time can make:
- growth
- drawdown
- volatility
much easier to understand.
Useful Dashboard Numbers
At the top of your spreadsheet, consider displaying:
Total Bets
Total Stakes
Total Returns
Profit/Loss
ROI
Strike Rate
Average Odds
Maximum Drawdown
Average CLV
These provide a quick overview.
Filters and Pivot Tables
Once your record becomes larger, filters and pivot tables can help analyse:
- course
- odds
- distance
- race type
- strategy
- month
- going
- model version
This allows you to explore the data without creating dozens of separate spreadsheets.
How Often Should You Review Your Betting Record?
Do not analyse every statistic after every bet.
That encourages overreaction.
A useful approach might be:
Record every bet immediately.
Perform a quick weekly check.
Conduct a deeper monthly review.
Carry out a major review after a predetermined number of bets.
The appropriate frequency depends on how often you bet.
What Should a Monthly Review Include?
Ask:
How many bets did I place?
What was my ROI?
What was my strike rate?
Did I beat the closing market?
What was the maximum drawdown?
Did I follow my strategy?
Were there any obvious execution problems?
Then compare the month with your longer-term record.
Do Not Change Strategy Every Month
A losing month does not necessarily require action.
A winning month does not prove your strategy is excellent.
The purpose of monthly reviews is:
monitoring
rather than:
constant optimisation.
When Should You Investigate Further?
Potential warning signs include:
- persistent negative CLV
- deteriorating calibration
- large unexpected drawdowns
- significant losses in previously strong categories
- strategy rules being ignored
- repeated failure to obtain expected prices
These are reasons to investigate.
They are not automatic instructions to abandon the strategy.
Common Horse Racing Betting Record Mistakes
Only Recording Winners
This makes the record worthless.
Record every bet.
Using Memory
Memory is selective.
Use data.
Changing Historical Prices
Record the odds actually obtained.
Do not replace them later with a better price.
Ignoring Commission
Use net exchange returns where appropriate.
Mixing Deposits With Profit
Keep cash movements separate.
Too Many Spreadsheet Columns
Only record data that serves a purpose.
Drawing Conclusions From Tiny Samples
A 100% ROI from:
five bets
does not prove anything useful.
Constantly Changing Strategy
If the rules continually change, you cannot determine what actually works.
Ignoring Drawdown
Final profit does not show how difficult the journey was.
Focusing Only on Win Rate
Odds determine whether the strike rate is profitable.
Ignoring Price Quality
The price you take is central to betting performance.
Deleting Bad Bets
They still affected your money.
Record them.
Chasing Historical Patterns
Finding a profitable subgroup does not automatically mean the pattern will continue.
Test it separately.
Horse Racing Betting Record Checklist
For every bet:
☐ Record the date
☐ Record the race
☐ Record the course
☐ Record the selection
☐ Record the bet type
☐ Record the actual odds taken
☐ Record the stake
☐ Record the result
☐ Record the return
☐ Calculate profit/loss
Where relevant:
☐ Record closing odds
☐ Record model probability
☐ Record fair odds
☐ Record estimated EV
☐ Record strategy
☐ Record model version
During reviews:
☐ Calculate ROI
☐ Calculate strike rate
☐ Check average odds
☐ Measure CLV
☐ Analyse odds bands
☐ Analyse race types
☐ Review drawdown
☐ Review losing runs
☐ Check probability calibration
☐ Compare strategy versions
☐ Investigate weaknesses
☐ Avoid overreacting to small samples
The Professional Betting Feedback Loop
A strong process looks like this:
Analyse
↓
Price
↓
Compare
↓
Bet
↓
Record
↓
Measure
↓
Review
↓
Improve
Then repeat.
This turns betting from a collection of isolated decisions into a measurable process.
How Betting Records Fit Into the British Racecourses Analysis Cluster
The wider journey now looks like:
Understand race analysis
↓
How to Analyse a Horse Race Like a Professional
↓
Understand pace and draw
↓
↓
↓
Create probabilities
↓
↓
Understand the bookmaker margin
↓
↓
Find value
↓
How to Find Value Bets in Horse Racing
↓
Calculate expected value
↓
Expected Value in Horse Racing Betting
↓
Measure market movement
↓
↓
Understand variance
↓
Betting Variance in Horse Racing
↓
Manage capital
↓
Horse Racing Bankroll Management
↓
Build a structured model
↓
How to Build a Horse Racing Betting Model
↓
Test it
↓
How to Test a Horse Racing Betting Model
↓
Record and analyse real decisions
↓
Horse Racing Betting Record
The record closes the loop.
It provides the evidence needed to determine whether your analysis is actually translating into better betting decisions.
Frequently Asked Questions
What is a horse racing betting record?
A horse racing betting record is a structured history of your bets, including information such as selections, odds, stakes, results and profit or loss.
Why should I keep a betting record?
It allows you to measure actual performance rather than relying on memory.
What should I record for every bet?
At minimum:
date, selection, odds, stake, result, return and profit/loss.
Should I record the racecourse?
Yes. This allows you to analyse performance by course.
Should I record the race type?
Yes. Race type can reveal whether your strategy performs differently in handicaps, maidens, chases, hurdles or other categories.
Should I record Starting Price?
It can be useful, particularly when comparing the odds you took with the later market.
What is ROI in horse racing betting?
ROI commonly measures profit relative to total stakes:
Profit ÷ Stakes × 100.
What is betting yield?
Yield is commonly calculated as profit divided by total stakes, expressed as a percentage.
What is strike rate?
Strike rate is the percentage of bets that win.
Is a high strike rate always good?
No. Strike rate must be considered alongside the odds taken.
Why should I record average odds?
Average odds help you interpret strike rate, losing runs and strategy volatility.
What is a betting drawdown?
Drawdown measures the decline from a previous betting-bank peak.
Should I record my longest losing run?
Yes. Losing runs help show the risk and volatility associated with your approach.
What is CLV?
Closing line value measures how the price you obtained compares with a later or closing market price.
Should I track CLV?
More advanced bettors can use CLV as an additional measure of price quality.
Does beating SP mean I will make money?
No. Consistently obtaining stronger prices can be useful evidence, but it does not guarantee profit.
Should I record my own fair odds?
Yes, if you create your own probabilities.
Should I record expected value?
If EV forms part of your strategy, recording your estimated EV allows you to test whether those estimates are meaningful.
How many bets do I need before analysing results?
You can monitor results immediately, but strong conclusions generally require much larger samples.
Are 100 bets enough?
They can provide useful early information, but variance can still dominate a 100-bet sample.
Should I analyse performance by odds?
Yes. This can reveal whether your strategy performs better or worse at particular prices.
Should I analyse different race types separately?
Yes, particularly if the strategy could logically perform differently across race categories.
Should I remove recreational bets from my record?
No. If money was genuinely risked, include them in your overall record but classify them separately.
Should deposits count as losses?
No. Deposits and withdrawals are cash movements rather than betting results.
Should I use pounds or points?
You can use either. Points make it easier to compare strategy performance when stake sizes or betting-bank values change.
What is the best software for keeping a horse racing betting record?
A spreadsheet is sufficient for most bettors. The important factor is consistent and accurate recording rather than sophisticated software.
How often should I review my betting record?
Record every bet immediately and conduct deeper reviews at predetermined intervals rather than constantly reacting to individual results.
Can betting records improve my betting?
They cannot guarantee better results, but they can reveal strengths, weaknesses, pricing errors and behavioural mistakes that are difficult to identify from memory.
Summary
A horse racing betting record turns betting history into usable evidence.
At minimum, record:
Date
Race
Selection
Odds
Stake
Result
Return
Profit/Loss
For deeper analysis, add:
Course
Race Type
Distance
Closing Odds
Model Probability
Fair Odds
Expected Value
Strategy
Model Version
Then measure:
ROI
Yield
Strike Rate
Average Odds
Closing Line Value
Maximum Drawdown
Longest Losing Run
Analyse results by:
odds
race type
distance
course
strategy
time period
and any other category that genuinely relates to your betting process.
Do not search your records simply to find flattering statistics.
Look for evidence that challenges your assumptions.
Do not delete poor bets.
Do not replace the odds you actually took.
Do not draw major conclusions from tiny samples.
And do not confuse a winning bet with a good decision.
The strongest betting record answers a much more useful question than:
How much did I win today?
It asks:
Am I repeatedly making decisions that appear to have a genuine long-term advantage?
That is where record keeping becomes valuable.
Analyse.
Bet.
Record.
Measure.
Review.
Improve.
Then repeat the process.
18+. Gambling involves financial risk. Only bet with money you can afford to lose.