Bookmaker overround is one of the most important concepts to understand if you want to analyse horse racing odds properly.
Every horse in a race has an implied probability based on its odds.
If the market represented perfectly fair prices with no bookmaker margin, the probabilities of every runner would add up to:
100%.
Bookmaker markets usually add up to more than 100%.
You might calculate:
105%
110%
115%
or considerably more.
The amount above 100% is commonly called the overround.
For example, if the implied probabilities of every horse total:
110%
the market has an overround of:
10%.
Understanding this matters because bookmaker odds are not simply predictions of which horse will win.
They are prices.
Those prices incorporate a margin.
Learning to calculate and remove that margin helps you understand what the market is really saying about each horse’s chance.
It also connects several important betting concepts:
Odds → Implied probability → Overround → Fair probability → Fair odds → Value → Expected value
Once you understand that chain, horse racing odds become much easier to analyse.
What Is Bookmaker Overround?
Overround is the amount by which the combined implied probabilities in a betting market exceed 100%.
Consider a theoretical two-runner event.
Both outcomes have exactly:
50% probability.
Fair decimal odds would therefore be:
2.00
and:
2.00.
The probabilities total:
100%.
Now imagine a bookmaker offers:
1.91
on each outcome.
The implied probability of 1.91 is approximately:
52.36%.
Two outcomes therefore produce:
52.36% + 52.36% = 104.72%.
The market overround is:
4.72%.
That additional percentage represents the margin built into the market.
Why Do Bookmakers Use Overround?
Bookmakers are businesses.
If they continually offered every outcome at mathematically fair odds, they would have no built-in pricing margin.
Instead, odds are generally constructed so that the combined implied probabilities exceed 100%.
That does not mean a bookmaker is guaranteed to make the exact overround percentage on every race.
Actual results depend on:
- the prices offered
- where customers place their money
- price movements
- promotions
- liabilities
- trading decisions
- the race result
Overround is better understood as the theoretical margin embedded in the market prices, rather than a guaranteed profit from an individual race.
How Do You Convert Odds Into Implied Probability?
Before calculating overround, you need to convert each horse’s odds into implied probability.
For decimal odds:
Implied Probability = 1 ÷ Decimal Odds × 100
Suppose a horse is:
4.00
The calculation is:
1 ÷ 4.00 × 100 = 25%
Therefore:
3/1 = 25% implied probability.
If the horse is:
6.00
then:
1 ÷ 6.00 × 100 = 16.67%
Therefore:
5/1 = approximately 16.67%.
Common Horse Racing Odds and Implied Probabilities
| Fractional Odds | Decimal Odds | Implied Probability |
|---|---|---|
| 1/2 | 1.50 | 66.67% |
| 4/6 | 1.67 | 60.00% |
| Evens | 2.00 | 50.00% |
| 2/1 | 3.00 | 33.33% |
| 3/1 | 4.00 | 25.00% |
| 4/1 | 5.00 | 20.00% |
| 5/1 | 6.00 | 16.67% |
| 8/1 | 9.00 | 11.11% |
| 10/1 | 11.00 | 9.09% |
| 20/1 | 21.00 | 4.76% |
These percentages become much more useful when you calculate them for every runner in the race.
A Simple Horse Racing Overround Example
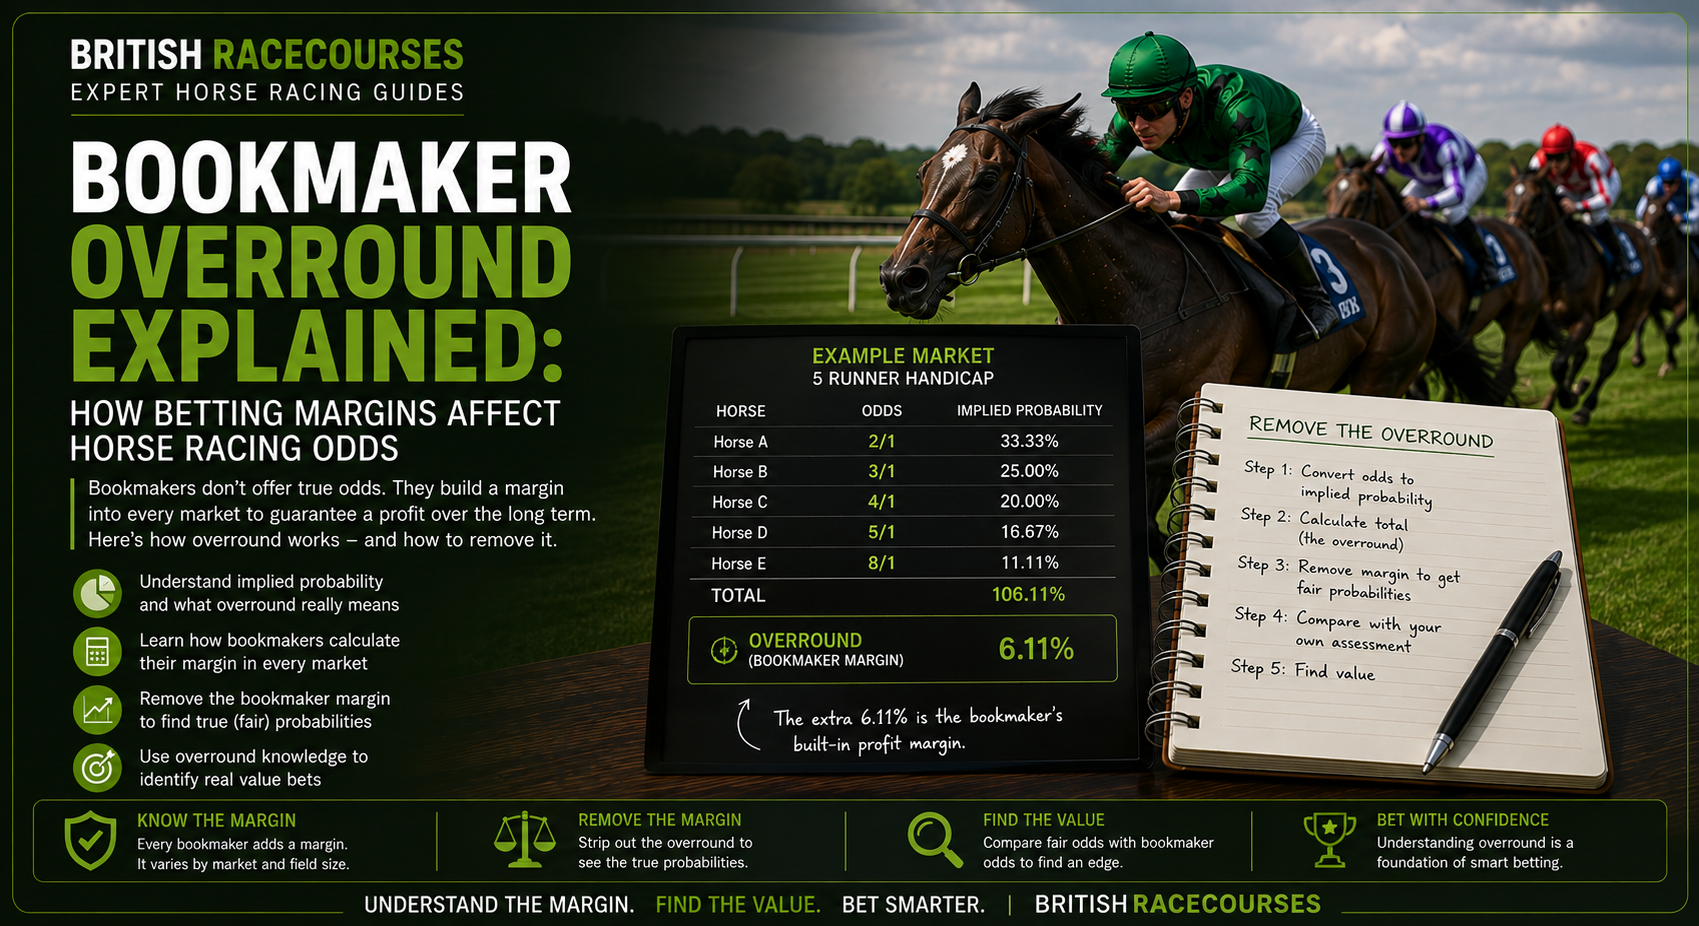
Imagine a five-runner race with these prices:
| Horse | Odds | Decimal | Implied Probability |
|---|---|---|---|
| Horse A | 2/1 | 3.00 | 33.33% |
| Horse B | 3/1 | 4.00 | 25.00% |
| Horse C | 4/1 | 5.00 | 20.00% |
| Horse D | 5/1 | 6.00 | 16.67% |
| Horse E | 8/1 | 9.00 | 11.11% |
Add the probabilities:
33.33 + 25 + 20 + 16.67 + 11.11
=
106.11%.
The overround is therefore:
106.11% – 100% = 6.11%.
That market contains a theoretical:
6.11% overround.
What Would a Fair Market Look Like?
A theoretical fair market would total:
100%.
Suppose the genuine probabilities were:
Horse A: 30%
Horse B: 25%
Horse C: 20%
Horse D: 15%
Horse E: 10%
Total:
100%.
The corresponding fair decimal odds would be:
| Horse | True Probability | Fair Decimal Odds |
|---|---|---|
| Horse A | 30% | 3.33 |
| Horse B | 25% | 4.00 |
| Horse C | 20% | 5.00 |
| Horse D | 15% | 6.67 |
| Horse E | 10% | 10.00 |
If a bookmaker offered those exact prices, there would be no built-in overround.
Real bookmaker markets generally do not work like that.
Why Overround Matters to Horse Racing Bettors
Overround tells you something about the overall pricing of a market.
Everything else being equal:
lower overround = more competitive market
because less theoretical margin is embedded across the prices.
But there is an important qualification.
A low-overround market does not mean every horse is a good bet.
And:
A high-overround market does not mean every horse is a bad bet.
You still need to evaluate the individual price.
Overround vs Value
Suppose a market has an overround of:
115%.
That sounds unattractive.
But you independently assess one horse as having:
25% chance of winning.
Your fair odds are:
4.00
or:
3/1.
One bookmaker offers:
5.00
or:
4/1.
Despite the relatively high overall market overround, that individual horse could still represent value according to your assessment.
The reverse can also happen.
A highly competitive market might have only:
103% overround
but a particular favourite could still be shorter than your fair price.
This is why our
How to Find Value Bets in Horse Racing page focuses on comparing the available price with your assessment of the horse’s genuine chance.
Overround Is a Market-Level Measure
Think of overround as describing:
the market as a whole.
Value describes:
the relationship between an individual price and your probability estimate.
The two concepts are connected but not identical.
This distinction prevents a common mistake:
Low overround = automatically good bet.
It does not.
How to Calculate Overround Step by Step
Use this process.
Step 1: Record Every Horse’s Price
Imagine:
Horse A: 3.00
Horse B: 4.00
Horse C: 5.00
Horse D: 6.00
Horse E: 9.00
Step 2: Convert Each Price Into Probability
Use:
1 ÷ odds
Horse A:
1 ÷ 3.00 = 33.33%
Horse B:
1 ÷ 4.00 = 25%
Horse C:
1 ÷ 5.00 = 20%
Horse D:
1 ÷ 6.00 = 16.67%
Horse E:
1 ÷ 9.00 = 11.11%
Step 3: Add the Probabilities
Total:
106.11%.
Step 4: Subtract 100%
106.11 – 100 = 6.11%.
Overround:
6.11%.
That is the basic calculation.
Why Horse Racing Overround Can Be Higher Than Two-Outcome Markets
Horse races can contain:
5 runners
8 runners
12 runners
20 runners
or even larger fields.
That creates more individual outcomes for bookmakers to price.
Margins can accumulate across those runners.
A small amount of margin incorporated into each price can produce a much larger combined overround.
This is one reason comparing prices becomes particularly important in large-field racing.
Field Size and Overround
Imagine each horse is priced only slightly shorter than its theoretical fair odds.
In a five-runner race, the cumulative effect may be relatively modest.
In a:
20-runner handicap
the effect across the entire field can be much larger.
Do not assume there is a fixed overround that applies to every horse race.
Market competitiveness varies.
Early Markets vs Mature Markets
Horse racing markets change.
Prices published well before a race can differ substantially from those available close to the off.
As more information enters the market, bookmakers and bettors react to:
- going changes
- non-runners
- jockey bookings
- market support
- weather
- updated opinions
- other bookmaker prices
The market can therefore become very different by race time.
Overround and Non-Runners
Non-runners complicate horse racing markets.
When a runner is withdrawn, bookmakers may:
- reform the market
- shorten other runners
- apply deductions to existing bets where applicable
The resulting market can have a different overround.
This is another reason to calculate overround using the current market, rather than assuming an earlier calculation still applies.
How to Remove the Bookmaker Margin
This is where overround becomes particularly useful.
Suppose the market probabilities total:
110%.
You want to estimate what the probabilities would look like if you proportionally removed that excess.
A simple method is:
Fair Probability = Implied Probability ÷ Total Market Percentage × 100
Consider a horse with:
33% implied probability
in a:
110% market.
Adjusted probability:
33 ÷ 110 × 100
=
30%.
The margin-free estimate is therefore:
30%.
Removing Overround From a Complete Market
Suppose we have:
| Horse | Market Probability |
|---|---|
| A | 33.33% |
| B | 25.00% |
| C | 20.00% |
| D | 16.67% |
| E | 11.11% |
Total:
106.11%.
Now divide each probability by:
1.0611
approximately.
The adjusted probabilities become roughly:
| Horse | Market Probability | Margin-Free Probability |
|---|---|---|
| A | 33.33% | 31.41% |
| B | 25.00% | 23.56% |
| C | 20.00% | 18.85% |
| D | 16.67% | 15.71% |
| E | 11.11% | 10.47% |
These adjusted probabilities total approximately:
100%.
You now have a simple estimate of the market’s margin-free probabilities.
Convert Margin-Free Probability Back Into Odds
Now use:
Fair Decimal Odds = 1 ÷ Probability
For Horse A:
Margin-free probability:
31.41%
Decimal:
0.3141
Fair odds:
1 ÷ 0.3141 ≈ 3.18
For Horse E:
Probability:
10.47%
Fair odds:
approximately 9.55
This gives you a theoretical no-margin version of the bookmaker’s market.
Is Removing Overround the Same as Creating Your Own Odds?
No.
This distinction is crucial.
Removing overround tells you:
what the bookmaker market might look like without its proportional margin.
Creating your own odds asks:
What do I independently believe each horse’s probability should be?
Those are different exercises.
Our
How to Price a Horse Race process is therefore the next step.
Market Fair Price vs Your Fair Price
Imagine removing the bookmaker margin produces:
Horse A:
Market fair price = 3.20
Your independent analysis produces:
Your fair price = 4.00
That is a substantial disagreement.
The market thinks the horse is more likely to win than you do.
Now imagine Horse B:
Market fair price:
6.00
Your price:
4.50
You believe Horse B has a better chance than the market suggests.
That is where potential value analysis begins.
Do Not Assume the Market Is Wrong
A disagreement does not automatically mean you found an opportunity.
Ask:
Why does my probability differ?
Perhaps you identified:
- a pace advantage
- favourable draw
- hidden sectional performance
- unsuitable conditions last time
- a positive class change
Or perhaps:
your analysis is wrong.
The market contains enormous amounts of information.
Treat disagreement as a reason to investigate, not automatic proof of value.
Overround and Pace Analysis
Suppose your
Horse Racing Pace Map identifies a horse likely to secure an uncontested lead.
Your own probability:
25%.
Market margin-free probability:
18%.
That difference may suggest the market has underestimated the tactical advantage.
But the pace map is still a prediction.
Another jockey may challenge for the lead.
Your 25% remains an estimate.
Overround and Draw Bias
The same principle applies to the
Suppose historical evidence suggests a particular stall has an advantage under today’s conditions.
Your model may increase that horse’s probability.
If the market has not fully reflected the advantage, a pricing discrepancy can emerge.
Again, the question is not:
Is the draw good?
It is:
How much should the draw change the horse’s probability?
Overround and Sectional Times
Horse Racing Sectional Times can uncover performances hidden by finishing position.
Suppose a horse finished seventh but recorded a strong closing sectional after being badly positioned.
Your analysis might rate that performance more highly than the market.
That could cause:
your fair odds
to differ from:
market fair odds.
This is where race analysis connects directly with pricing.
Overround and Favourite-Longshot Bias
Removing margin proportionally assumes the bookmaker margin is effectively distributed in a straightforward way across the market.
Real markets can be more complicated.
Different parts of a betting market may behave differently.
Our
Horse Racing Favourite-Longshot Bias page explains why outsiders and favourites can display different pricing characteristics.
This matters when interpreting margin-free probabilities.
A simple proportional adjustment is useful.
It should not be treated as a perfect reconstruction of every bookmaker’s underlying opinion.
What Does 105% Overround Mean?
A:
105% market
contains:
5 percentage points
above a theoretical 100% fair market.
Generally, that represents a relatively competitive book compared with a:
115%
or:
125%
market.
But remember:
the percentage does not tell you where the margin sits.
You still need to analyse individual prices.
What Does 110% Overround Mean?
A:
110% market
contains:
10 percentage points
above 100%.
This does not mean the bookmaker is guaranteed to make exactly:
10% profit
from all bets on the race.
Actual profitability depends on how money is distributed and how liabilities are managed.
What Does 120% Overround Mean?
A:
120% market
contains a substantial theoretical margin.
All else being equal, bettors would generally prefer more competitive pricing.
But individual bookmakers may offer very different prices on specific horses.
This is why price comparison matters.
Comparing Bookmakers Using Overround
Imagine the same race is available with three bookmakers.
Bookmaker A:
105% market
Bookmaker B:
110% market
Bookmaker C:
116% market
At first glance, Bookmaker A has the most competitive overall book.
But suppose your selection is:
6/1 with A
13/2 with B
7/1 with C
If you have already decided to back that particular horse and relevant terms are otherwise equal, Bookmaker C offers the strongest individual win price despite having the largest overall market overround.
That demonstrates why overround should complement rather than replace price comparison.
Compare the Horse, Not Just the Market
This is particularly important for racing bettors.
Your objective is usually not to back:
the entire market.
You are selecting individual horses.
Therefore:
overall overround = useful market information
but:
your selection’s available price = critical betting information.
British Racecourses already recommends comparing prices across operators because small differences can materially change returns over repeated bets.
Why Multiple Bookmakers Can Matter
Suppose you want Horse A.
Prices:
Bookmaker 1:
4/1
Bookmaker 2:
9/2
Bookmaker 3:
5/1
Bookmaker 4:
11/2
Your analysis does not change.
The horse does not become more likely to win because you use Bookmaker 4.
But your potential return improves.
This is one reason some bettors use
Multiple Bookmaker Accounts to compare available prices and terms.
Overround and Betting Exchanges
Betting exchanges work differently from traditional bookmakers.
Customers can bet against each other, while the exchange typically charges commission on net winnings according to its rules.
Exchange prices can therefore provide another useful market reference.
However, you cannot compare the headline exchange odds directly with bookmaker prices without considering:
- commission
- liquidity
- available stake
- market depth
See our
UK Betting Exchange Sites guide for more information.
Exchange Markets Can Still Have a Spread
Do not assume:
exchange = perfectly fair probability.
Back and lay prices differ.
Liquidity varies.
Commission affects returns.
The exchange market can nevertheless provide useful information about how other market participants are pricing a horse.
Starting Price and Overround
The Starting Price represents the market at the start of the race.
You can calculate an overround from the SPs just as you can from earlier bookmaker prices.
But that tells you about:
the SP market
not necessarily the market when you originally placed your bet.
If you backed:
8/1
and the horse started:
5/1
your decision should be evaluated using the price you actually obtained.
This connects directly with
Closing Line Value in Horse Racing.
Overround and Closing Line Value
Suppose you back:
Horse A at 10/1.
Later it starts:
7/1.
That does not guarantee the bet was good.
But consistently obtaining prices greater than the later market can provide useful evidence about your pricing process.
Overround adds another layer.
You can compare:
raw market probability
and:
margin-adjusted market probability
at different points in time.
This gives you a clearer picture of how the market’s assessment changed.
Overround and Expected Value
Overround describes the market.
Expected Value in Horse Racing Betting describes the theoretical return of an individual bet according to your probability estimate.
Suppose:
Your probability:
25%
Bookmaker odds:
5.00
Your expected return from £1 is:
0.25 × £5 = £1.25
Expected profit:
£0.25
Theoretical EV:
+25%.
The market’s overall overround does not change that calculation.
Your probability and the individual price determine your estimated EV.
High Overround Does Not Make Value Impossible
This deserves repeating.
Imagine a relatively poor:
120% market.
You identify one horse at:
12/1
that you believe should be:
7/1.
According to your assessment, the individual price can still represent value.
The market can be expensive overall while containing a particular pricing error.
Low Overround Does Not Guarantee Value
Now consider a:
102% market.
Very competitive.
You back a horse at:
2/1
that you believe should be:
3/1.
The overall market is efficient.
Your individual bet is still poor according to your own analysis.
Never substitute market overround for individual price assessment.
Overround and Betting Models
Overround becomes particularly important when building a
Suppose your model predicts:
Horse A:
28%
Horse B:
24%
Horse C:
20%
Horse D:
16%
Horse E:
12%
Total:
100%.
Now compare those probabilities with the bookmaker’s margin-adjusted market probabilities.
You can calculate:
Model Probability – Market Fair Probability
for every horse.
This creates a simple measure of disagreement.
Example Model vs Market
| Horse | Your Model | Margin-Free Market | Difference |
|---|---|---|---|
| A | 28% | 31% | -3% |
| B | 24% | 22% | +2% |
| C | 20% | 19% | +1% |
| D | 16% | 14% | +2% |
| E | 12% | 14% | -2% |
Your model is most positive relative to the market about:
Horse B
and:
Horse D.
That does not automatically mean bet.
Now compare the actual available odds with your fair prices.
Do Not Confuse Difference With Edge
Suppose your model says:
25%
and the market’s margin-free probability is:
20%.
You might call that a:
5 percentage-point disagreement.
But your model could be wrong.
The word edge should therefore be used carefully.
A better description before validation is:
estimated edge.
That keeps the uncertainty clear.
Overround and Kelly Criterion
The
Kelly Criterion for Horse Racing Betting uses:
- your probability
- available odds
- betting bank
to calculate a theoretical stake.
Overround itself is not the Kelly input.
But understanding bookmaker margin can improve your interpretation of market probability before comparing it with your own estimate.
Never use the raw bookmaker implied probability as if it were automatically the true probability.
Overround and Betting Variance
A low-margin market does not remove uncertainty.
A value bet can still lose.
A horse you correctly identify as overpriced by the market can lose repeatedly.
Our
Betting Variance in Horse Racing guide explains why good betting decisions can still produce losing sequences.
Overround concerns price.
Variance concerns results around expectation.
Overround and Bankroll Management
Do not increase stakes simply because you believe a market has a low overround.
Likewise, do not stake heavily because your model disagrees strongly with the bookmaker.
Your
Horse Racing Bankroll Management rules should still determine how much capital you expose.
Price analysis and risk management solve different problems.
Can You Use Overround to Find the Best Bookmaker?
It can help.
If one bookmaker consistently offers lower-margin racing markets, that can indicate more competitive overall pricing.
But bookmaker comparison should also consider:
- individual odds
- each-way terms
- extra places
- Best Odds Guaranteed
- maximum payouts
- payments
- withdrawals
- account features
Our
Best Horse Racing Betting Sites comparison covers the wider bookmaker picture.
Best Odds Guaranteed and Overround
Best Odds Guaranteed can affect the eventual settlement price of an eligible winning bet.
It does not change the horse’s underlying probability.
It also does not mean you should ignore the early price.
Compare the available odds and check the bookmaker’s current BOG eligibility and terms.
Each-Way Markets and Overround
Each-way betting introduces additional complexity.
An each-way bet contains:
win portion
and:
place portion.
The value of the place element depends on:
- number of places
- place fraction
- field size
- horse’s place probability
- win odds
A simple win-market overround calculation does not tell you whether the each-way terms are attractive.
This is why
Extra Places can materially alter the proposition on some races.
Why Big Handicaps Need Careful Price Comparison
Large handicaps can contain:
15
20
or more runners.
With many outcomes being priced, small differences between bookmakers can become important.
One operator might offer:
10/1
another:
12/1
another:
14/1
on exactly the same horse.
If you believe the horse is a bet, accepting the weakest price unnecessarily reduces the potential return.
Overround Does Not Tell You Who Will Win
This sounds obvious.
But it is important.
Overround is a pricing concept.
It tells you nothing directly about:
- form
- class
- going
- pace
- draw
- jockey
- trainer
- fitness
Those factors belong to race analysis.
Start with
How to Analyse a Horse Race Like a Professional before turning your opinion into probabilities.
A Complete Worked Example
Imagine a six-runner race.
The bookmaker offers:
| Horse | Decimal Odds | Implied Probability |
|---|---|---|
| A | 3.00 | 33.33% |
| B | 4.00 | 25.00% |
| C | 5.00 | 20.00% |
| D | 7.00 | 14.29% |
| E | 10.00 | 10.00% |
| F | 15.00 | 6.67% |
Total:
109.29%.
Overround:
9.29%.
Now remove the margin proportionally.
Divide each probability by:
1.0929.
Approximate margin-free probabilities:
| Horse | Market Probability | Margin-Free Probability |
|---|---|---|
| A | 33.33% | 30.50% |
| B | 25.00% | 22.87% |
| C | 20.00% | 18.30% |
| D | 14.29% | 13.07% |
| E | 10.00% | 9.15% |
| F | 6.67% | 6.10% |
Now compare those with your own probabilities:
| Horse | Market Fair % | Your % |
|---|---|---|
| A | 30.50% | 27% |
| B | 22.87% | 21% |
| C | 18.30% | 25% |
| D | 13.07% | 12% |
| E | 9.15% | 9% |
| F | 6.10% | 6% |
Your biggest disagreement is:
Horse C.
The market’s margin-free probability:
18.30%.
Your probability:
25%.
Your fair odds:
4.00
Bookmaker odds:
5.00.
According to your assessment, Horse C potentially represents value.
That is how overround becomes useful.
Not because it selects Horse C.
But because it helps you understand the market price before comparing it with your own.
The Professional Process
A structured approach looks like this:
Analyse the race
↓
Estimate probabilities
↓
Create fair odds
↓
Record bookmaker prices
↓
Calculate implied probabilities
↓
Calculate market overround
↓
Remove the margin
↓
Compare market probabilities with yours
↓
Identify meaningful disagreements
↓
Investigate why
↓
Bet only when the available price justifies it
This is much more useful than simply asking:
Which horse is favourite?
Common Overround Mistakes
Assuming Overround Equals Guaranteed Bookmaker Profit
It does not.
Looking Only at the Favourite
Overround is calculated across the entire market.
Thinking Lower Overround Makes Every Bet Better
It doesn’t.
Ignoring Individual Prices
A higher-overround bookmaker can still offer the best price on your particular horse.
Treating Margin-Free Market Probability as Truth
It remains the market’s assessment, not objective certainty.
Confusing Market Probability With Your Probability
Your independent assessment should remain separate.
Ignoring Market Changes
Overround can change as prices move.
Forgetting Commission
Exchange prices require commission to be considered.
Ignoring Each-Way Terms
Win-market overround does not fully describe an each-way proposition.
Overround Checklist
Before using overround in your analysis, ask:
☐ Have I recorded the current price of every runner?
☐ Have I converted each price into implied probability?
☐ What do the probabilities total?
☐ How far above 100% is the market?
☐ Have I removed the margin consistently?
☐ What does the market’s fair probability suggest?
☐ What is my independent probability?
☐ Why do the two differ?
☐ Is the difference large enough to matter?
☐ Have I compared the same horse across bookmakers?
☐ Have I considered exchange prices?
☐ Have I checked current each-way terms where relevant?
☐ Am I analysing value rather than simply looking for a winner?
How Overround Fits Into the British Racecourses Analysis Cluster
We can now connect the process clearly:
Learn how odds work
↓
↓
Convert odds into probability
↓
Calculate bookmaker overround
↓
Remove the bookmaker margin
↓
Analyse the race
↓
How to Analyse a Horse Race Like a Professional
↓
Create your own probability
↓
↓
Compare your price with the market
↓
How to Find Value Bets in Horse Racing
↓
Calculate expected value
↓
Expected Value in Horse Racing Betting
↓
Track how the market moves
↓
Closing Line Value in Horse Racing
↓
Understand short-term results
↓
Betting Variance in Horse Racing
↓
Manage capital
↓
Horse Racing Bankroll Management
↓
Determine stakes
↓
Kelly Criterion for Horse Racing Betting
↓
Bring the analysis together
↓
How to Build Your Own Horse Racing Betting Model
Overround fills an important gap near the beginning of that process.
Frequently Asked Questions
What is overround in horse racing?
Overround is the amount by which the combined implied probabilities of every runner exceed 100%.
How do bookmakers calculate overround?
Convert every runner’s odds into implied probability, add the probabilities together and subtract 100%.
What does a 110% book mean?
It means the implied probabilities total 110%, producing an overround of 10 percentage points.
What would a completely fair betting market total?
A theoretical no-margin market would total 100%.
Is overround the bookmaker’s profit?
Not exactly. It represents theoretical margin built into the prices. Actual bookmaker profit depends on betting activity, liabilities, results and other factors.
Is lower overround better?
Everything else being equal, a lower-overround market offers more competitive overall pricing.
Does low overround mean every horse is good value?
No. Individual horses can still be overpriced.
Can a value bet exist in a high-overround market?
Yes. Your individual selection could still be available at odds greater than your estimate of its fair price.
How do I calculate implied probability?
For decimal odds:
1 ÷ decimal odds × 100.
What is the implied probability of 2/1?
2/1 corresponds to decimal odds of 3.00, giving approximately:
33.33%.
What is the implied probability of 3/1?
25%.
What is the implied probability of 4/1?
20%.
What is the implied probability of 5/1?
Approximately:
16.67%.
How do I remove bookmaker margin?
A simple proportional method divides each implied probability by the total market percentage and rescales the results to 100%.
Does removing overround reveal the true probabilities?
No. It gives you a margin-free interpretation of the market prices. The market can still be wrong.
Should I create my own probabilities?
If you want to analyse value independently, creating your own probabilities allows you to compare your assessment with the market.
Why do probabilities add up to more than 100%?
Because bookmakers generally incorporate a margin into their prices.
Does field size affect overround?
It can. Larger fields contain more outcomes and can produce larger cumulative margins, although market competitiveness varies.
Does overround change before a race?
Yes. Prices move, non-runners occur and market conditions change.
Can I calculate overround from Starting Prices?
Yes. Convert every runner’s SP into implied probability and add them together.
Do betting exchanges have overround?
Exchange markets operate differently. Back and lay prices create a spread and commission affects net returns, so the traditional bookmaker overround calculation does not tell the whole story.
Is overround important for each-way betting?
The win market overround is relevant, but each-way value also depends on the place fraction and number of places.
Should I choose a bookmaker solely because it has low overround?
No. Compare the individual price you need alongside relevant terms and features.
Why should I compare bookmaker prices?
Different bookmakers can offer different odds on exactly the same horse. Securing a stronger price improves your potential return without changing the underlying race outcome.
Is overround the same as expected value?
No. Overround describes the overall market margin. Expected value estimates the theoretical return of an individual bet based on your probability assessment.
Is overround the same as value?
No. Value is determined by comparing an individual available price with your estimate of the outcome’s probability.
Can overround help with a betting model?
Yes. Removing the margin gives you a cleaner market probability benchmark to compare with your model’s probabilities.
Summary
Bookmaker overround explains why the implied probabilities in a horse racing market usually add up to more than:
100%.
If the probabilities total:
106%
the market has approximately:
6% overround.
If they total:
115%
the overround is:
15%.
The calculation is straightforward:
Convert every price into probability → Add the probabilities → Subtract 100%.
But calculating overround is only the beginning.
You can also remove the margin to estimate the market’s no-margin probabilities.
Those probabilities provide a useful benchmark.
You can then compare:
the market’s assessment
with:
your assessment.
That is where overround becomes particularly valuable for serious race analysis.
Do not assume a low-overround market automatically contains good bets.
And do not assume a high-overround market cannot contain value.
Your individual price still matters.
The stronger process is:
Understand the bookmaker margin.
Remove it.
Create your own fair probabilities.
Compare the two.
Investigate meaningful disagreements.
Compare prices across bookmakers.
Bet only when the available odds justify the risk.
Overround therefore sits at an important point between understanding basic betting odds and performing more advanced value analysis.
It helps turn a bookmaker’s displayed prices into something much more useful:
probabilities you can analyse.
18+. Gambling involves financial risk. Only bet with money you can afford to lose.