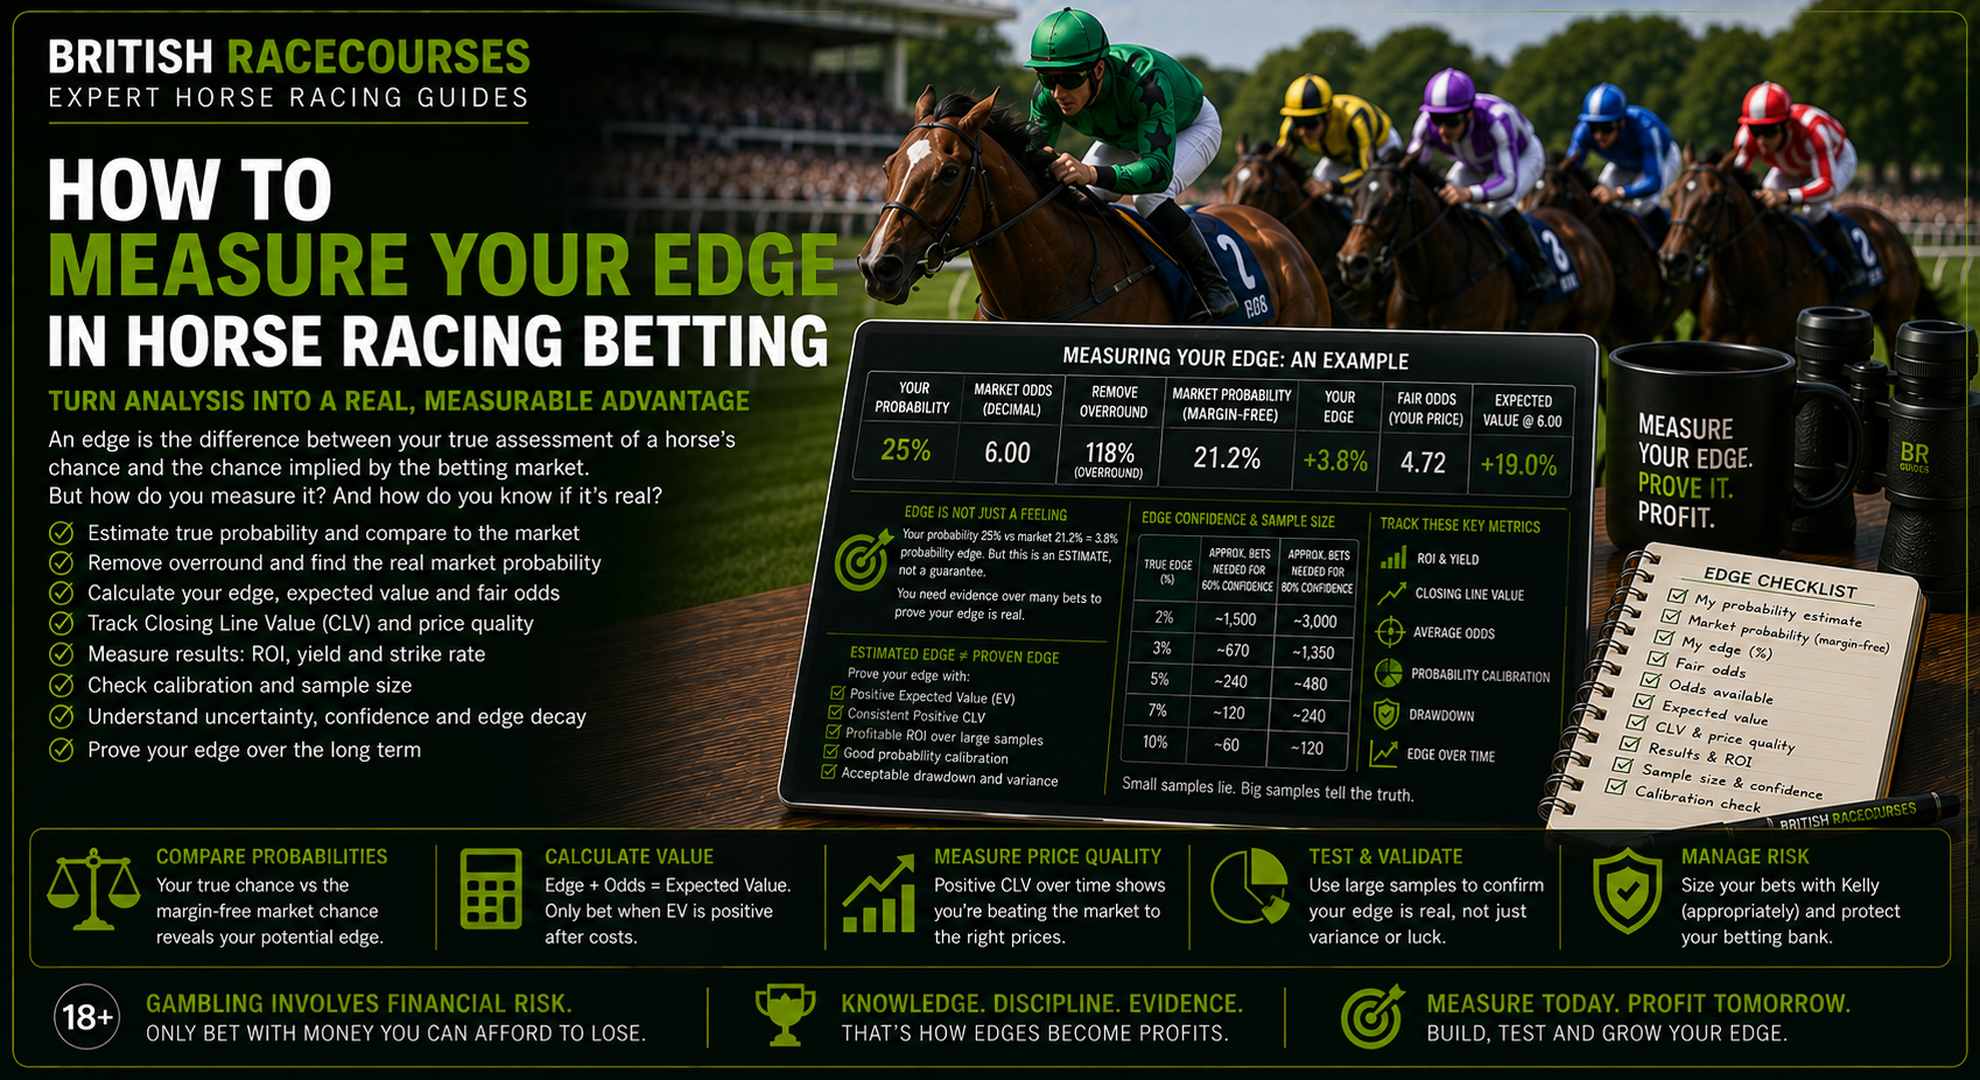
Finding a horse you think is overpriced is only the beginning.
The harder question is:
How big is your edge?
And the even harder question is:
Is that edge actually real?
A bettor might estimate that a horse has a 25% chance of winning while the betting market implies a 20% chance.
At first glance, that appears to create a:
5 percentage-point edge.
But there is an important distinction:
Estimated edge does not equal proven edge.
Your probability could be wrong.
The market could be right.
Both estimates could be wrong.
Short-term results can also be dominated by variance.
Measuring an edge properly therefore requires more than comparing two numbers. You need to examine probability, bookmaker margin, available odds, expected value, closing prices, calibration, results and sample size.
This page explains how to do it.
What Is a Betting Edge?
A betting edge exists when the odds available underestimate the true probability of an outcome.
Suppose you believe a horse has:
25% chance of winning.
Its fair decimal odds are:
4.00
because:
1 ÷ 0.25 = 4.00
Now suppose a bookmaker offers:
5.00
The bookmaker is offering a bigger price than your estimated fair price.
If your probability assessment is accurate, you have a theoretical advantage.
That is your estimated betting edge.
Edge Is About Price, Not Picking Winners
This is fundamental.
Horse A might have:
60% chance of winning.
Horse B might have:
10% chance of winning.
Horse A is clearly more likely to win.
But that does not necessarily make Horse A the better bet.
Imagine the prices are:
Horse A: 1.40
Horse B: 15.00
Your fair prices are:
Horse A: 1.67
Horse B: 10.00
Horse A is the likely winner but potentially a poor bet.
Horse B is unlikely to win but potentially an attractive bet.
This is why our How to Find Value Bets in Horse Racing page focuses on the relationship between probability and price.
Step 1: Estimate the Horse’s Probability
Everything starts with probability.
Before looking for an edge, estimate the chance that the horse wins.
For example:
Horse A: 30%
Horse B: 25%
Horse C: 20%
Horse D: 15%
Horse E: 10%
Total:
100%.
These are your probabilities.
They represent your assessment of the race.
Our How to Price a Horse Race guide explains this process in detail.
Convert Probability Into Fair Odds
The formula is:
Fair decimal odds = 1 ÷ probability
For Horse B:
1 ÷ 0.25 = 4.00
Therefore:
25% = 4.00
20% = 5.00
10% = 10.00
5% = 20.00
These are theoretical fair prices before any bookmaker margin.
Step 2: Calculate the Market Probability
Next, examine the market.
Suppose a bookmaker offers:
5.00
The basic implied probability is:
1 ÷ 5.00 = 20%.
You estimate:
25%.
Raw market probability:
20%.
Difference:
5 percentage points.
That looks attractive.
But there is another step.
Step 3: Remove the Bookmaker Margin
Bookmaker odds normally contain an overround.
The implied probabilities across every runner might total:
105%
rather than:
100%.
You should therefore avoid treating the raw bookmaker probability as a perfectly clean market estimate.
Our Bookmaker Overround Explained guide covers this calculation in detail.
Simple Margin Removal Example
Imagine a horse has a raw implied probability of:
21%.
The total market book is:
105%.
A simple proportional adjustment is:
21 ÷ 105 = 20%.
The margin-free market probability is therefore approximately:
20%.
Remember that proportional margin removal is only one method of estimating margin-free probabilities.
It does not reveal the horse’s objective true chance.
It simply provides a cleaner market benchmark.
Step 4: Calculate Your Probability Edge
Now compare:
Your probability
with:
Margin-free market probability.
Example:
Your probability:
25%
Market probability:
20%
Estimated probability edge:
25% − 20% = 5 percentage points.
This is one useful way of expressing your disagreement with the market.
Percentage Points vs Percentage Difference
Be careful with terminology.
Moving from:
20%
to:
25%
is an increase of:
5 percentage points.
But relative to 20%, your estimate is:
25% higher.
These are not the same calculation.
For betting analysis, percentage-point differences are often easier to interpret.
Step 5: Calculate Expected Value
Probability edge alone does not tell you the complete betting proposition.
You also need to consider the odds available.
Suppose:
Your probability = 25%
Available odds = 5.00
£1 stake.
If the horse wins:
Return = £5
Expected return:
0.25 × £5 = £1.25
Expected profit:
£1.25 − £1 = £0.25
Estimated expected value:
+25%.
Our Expected Value in Horse Racing Betting page explains EV in greater depth.
EV Depends Entirely on Your Probability
This point cannot be overstated.
Suppose you estimated:
25%.
But the horse’s genuine chance was closer to:
18%.
At odds of 5.00:
0.18 × £5 = £0.90
Expected profit:
−£0.10
EV:
−10%.
The same bet has changed from:
+25% EV
to:
−10% EV
because the probability estimate changed.
The mathematics was never the difficult part.
Estimating probability accurately is the challenge.
Step 6: Compare Your Price With the Market
Your own fair odds provide another intuitive way to measure the apparent edge.
Suppose:
Your fair odds:
4.00
Available odds:
5.00
You are effectively saying:
I would be willing to bet this horse at anything above 4.00, subject to an appropriate safety margin.
The market offers:
5.00.
That difference is your potential pricing opportunity.
Bigger Price Difference Does Not Automatically Mean Bigger Genuine Edge
Suppose your model prices a horse:
3.00
and the market offers:
10.00.
That is a huge disagreement.
Your first reaction should not necessarily be:
massive bet.
It should be:
Why is my assessment so different from the market?
Large disagreements deserve investigation.
Perhaps your model has found something valuable.
Perhaps it contains an error.
Step 7: Understand the Market as a Benchmark
The betting market contains information from:
- bookmakers
- professional bettors
- recreational bettors
- exchange traders
- form analysts
- statistical models
- race-day information
That makes it a useful benchmark.
Our Horse Racing Market Efficiency page explains why markets can be difficult to beat consistently.
You do not need to assume:
the market is always right.
But you should not assume:
you are right whenever you disagree with it.
Estimated Edge vs Proven Edge
This is the most important distinction on this page.
Suppose:
Your probability:
30%
Market probability:
25%
Estimated edge:
5 percentage points.
You have calculated:
an estimated edge.
You have not proved:
a genuine 5-point advantage.
Proof requires evidence.
Why Your Estimate Contains Uncertainty
Your probability may depend on:
- form
- pace
- draw
- going
- trainer performance
- jockey
- sectional times
- ratings
- model coefficients
- subjective adjustments
Every input contains uncertainty.
That uncertainty flows into your final probability.
A probability displayed as:
27.4%
might look precise.
That does not mean it is accurate to one decimal place.
How Do You Prove an Edge?
You need repeated evidence.
Useful evidence includes:
- positive expected value estimates
- consistently obtaining stronger prices than later markets
- good probability calibration
- positive ROI over meaningful samples
- performance across independent periods
- robustness across different conditions
No single metric is enough.
Together, they can build a stronger case.
Closing Line Value as Evidence
One of the most useful measurements is Closing Line Value.
Suppose you repeatedly back horses at:
8.00
that later start:
6.00.
Your price:
8.00 = 12.5% raw implied probability
Closing price:
6.00 = 16.7% raw implied probability
You consistently obtained a bigger price than the later market.
That does not guarantee profit.
But it provides useful information about your price selection.
Why CLV Can Matter
Race results are noisy.
A good bet can lose.
A poor bet can win.
Closing prices provide an additional benchmark that does not depend entirely on whether today’s horse crossed the line first.
Negative CLV Deserves Investigation
Suppose you repeatedly take:
4/1
about horses that start:
8/1.
You may still experience profitable periods.
But consistent negative CLV raises an important question:
Why does the later market repeatedly disagree with my bets?
That does not automatically prove your selections are poor.
But it deserves investigation.
ROI Measures Financial Results
Return on investment measures what actually happened to your money.
A basic formula is:
ROI = Profit ÷ Total Stakes × 100
Suppose:
Total stakes:
£10,000
Profit:
£600
ROI:
6%.
That is useful.
But ROI alone does not prove your edge is:
6%.
Why Realised ROI and True Edge Differ
Suppose your genuine long-term edge is:
3%.
You could still produce:
+15% ROI
over one period.
Or:
−8% ROI
over another.
That is Betting Variance.
Realised results fluctuate around the underlying expectation.
Yield
Yield is frequently used in betting records to describe profit relative to total stakes.
If:
Total staked = £5,000
Profit = £250
Yield = 5%.
Terminology can differ between bettors and organisations, so define the calculation clearly whenever comparing records.
Strike Rate
Strike rate is:
Winners ÷ Bets × 100
Suppose:
500 bets
100 winners
Strike rate:
20%.
Strike rate becomes particularly useful when compared with:
average odds
and:
expected probabilities.
A 20% strike rate means very little without knowing the prices involved.
Average Odds
Consider two bettors.
Bettor A:
Strike rate 35%
Bettor B:
Strike rate 15%
You cannot conclude Bettor A has the better strategy.
Perhaps Bettor A averages:
2.50
while Bettor B averages:
10.00.
Price context matters.
Probability Calibration
Calibration asks:
When you say something has a certain probability, how often does it actually happen?
Suppose your model produces 500 selections between:
24% and 26%.
You can reasonably group them around:
25%.
If the model is well calibrated, approximately one-quarter should win over a sufficiently large and representative sample.
Calibration Example
Your 25% probability group contains:
400 horses.
Actual winners:
101.
Actual strike rate:
25.25%.
That is encouraging calibration evidence.
Now imagine:
Actual winners:
61.
Strike rate:
15.25%.
Your model may be systematically overestimating those horses.
Calibration Is Different From Profitability
A model can be well calibrated but unprofitable.
Why?
Because the market may be even better.
Suppose your model correctly identifies a horse as:
25%.
But bookmakers consistently offer:
3.50
rather than fair odds of:
4.00.
Your probabilities might be accurate.
Your bets can still be poor.
Measure Edge by Probability Band
Do not analyse only your complete record.
Group bets according to your estimated edge.
For example:
| Estimated Edge | Bets | ROI | CLV |
|---|---|---|---|
| 0–2% | 600 | -1% | +0.3% |
| 2–5% | 500 | +2% | +1.4% |
| 5–10% | 300 | +6% | +3.1% |
| 10%+ | 100 | +1% | -0.8% |
This hypothetical table reveals something interesting.
The:
5–10%
group performs strongly.
But the:
10%+
group does not.
That might indicate your largest supposed edges are actually:
model errors.
Very Large Edges Deserve Scepticism
Imagine your model regularly finds:
25% edges
in highly liquid markets.
That would be extraordinary.
Possible explanations include:
- You have an exceptional model.
- You are comparing probabilities incorrectly.
- Your data contains leakage.
- Your market prices are unrealistic.
- Your probability estimates are badly calibrated.
- Your backtest contains overfitting.
Extraordinary apparent edges should trigger additional testing.
Edge by Odds Band
Break results down by price.
For example:
Under 2.00
2.00–3.99
4.00–7.99
8.00–14.99
15.00+
Your model might perform well at shorter prices but systematically overestimate outsiders.
That can be hidden inside overall results.
This is particularly relevant when considering Favourite-Longshot Bias.
Edge by Race Type
Analyse performance across:
- handicaps
- non-handicaps
- maidens
- novice races
- Group races
- Listed races
- chases
- hurdles
A strategy may have genuine predictive strength in one area and very little elsewhere.
Edge by Flat and Jumps
Do not automatically assume the same variables work equally well across:
Flat racing
and:
National Hunt racing.
The importance of:
- pace
- jumping
- distance
- going
- draw
- field position
can differ substantially.
Edge by Distance
Analyse:
- sprints
- middle distances
- staying races
A model might understand sprint pace particularly well but struggle with staying races.
Edge by Going
Compare results on:
- firm
- good
- soft
- heavy
- all-weather surfaces
If your edge disappears under certain conditions, investigate why.
Edge by Course
British racecourses vary substantially.
Our Racecourses section explains the characteristics of individual tracks.
Your analysis may work particularly well at certain course types.
But be careful.
Small course-specific samples can create misleading conclusions.
Measure the Sources of Your Edge
Suppose your race analysis includes:
- form
- pace
- draw
- sectionals
- trainer data
- market data
Which components actually improve your predictions?
Test them.
Pace
Use Horse Racing Pace Maps to estimate likely race shape.
Then test whether your pace adjustments improve:
- calibration
- CLV
- ROI
Draw
Use the Horse Racing Draw as another variable.
Do your draw adjustments improve probabilities?
Or are you simply adding complexity?
Sectional Times
Horse Racing Sectional Times can reveal performance hidden by finishing positions.
Again, test whether using them improves your results.
Compare Your Model With a Baseline
A betting model should outperform something.
Useful baselines could include:
market probabilities
Starting Price
or:
a simpler version of your own model.
Suppose:
Simple model accuracy: X
Complex model accuracy: slightly better than X
But the complex model:
- overfits
- produces unstable probabilities
- requires much more data
- performs worse out of sample
The extra complexity might not be worthwhile.
Measure Edge Out of Sample
Never judge a model solely on the data used to create it.
If you repeatedly adjust rules until historical profit looks excellent, you can accidentally design a model that explains:
the past
rather than predicts:
the future.
This is why How to Test a Horse Racing Betting Model emphasises out-of-sample testing.
Training Data
Used to build the model.
Validation Data
Used to refine decisions.
Test Data
Held back to assess genuine performance.
The final test should contain races the model did not effectively memorise during development.
Sample Size Matters
This is where many betting strategies fall apart.
Imagine:
20 bets
Profit:
+30%.
That tells you very little.
One large-priced winner could explain the entire result.
Now imagine:
2,000 bets
Positive CLV
Positive ROI
Good calibration
Stable results across multiple periods
That is much stronger evidence.
There Is No Magic Number
You cannot say:
1,000 bets always proves an edge.
Required sample size depends on:
- odds
- strike rate
- edge size
- variance
- bet independence
- strategy type
Small theoretical edges can require very large samples before the evidence becomes convincing.
Profit Concentration
Suppose a strategy makes:
£5,000 profit.
Excellent?
Maybe.
Now discover that one:
100/1 winner
produced:
£4,500
of that profit.
Your interpretation changes.
Always ask:
How concentrated are the results?
A robust edge should ideally not depend entirely on one extraordinary outcome.
Maximum Drawdown
An edge does not remove losing periods.
Track maximum drawdown.
Suppose your betting bank reaches:
£10,000
then falls to:
£7,500
before recovering.
Drawdown:
25%.
Understanding drawdown helps determine whether the strategy’s risk is acceptable.
Our Horse Racing Bankroll Management page explains how to protect betting capital.
Losing Runs
Even profitable strategies experience losing sequences.
A strategy with:
15% strike rate
will naturally encounter longer losing runs than one with:
60% strike rate.
Do not abandon a method simply because:
eight bets lost in a row.
Instead compare the losing run with what is statistically plausible for the strategy.
Edge Confidence
It can be helpful to think about edge in levels.
Level 1: Hypothesis
You believe something may be mispriced.
Level 2: Estimated Edge
Your probability differs from the market.
Level 3: Backtested Evidence
Historical data supports the hypothesis.
Level 4: Out-of-Sample Evidence
The edge survives unseen data.
Level 5: Market Evidence
You consistently obtain positive CLV.
Level 6: Real-World Evidence
Results remain positive across a meaningful live sample.
The further you progress, the stronger the evidence becomes.
But uncertainty never disappears completely.
Edge Decay
Betting edges can change.
Suppose you discover that a particular type of horse is systematically underpriced.
Over time:
- other bettors notice
- bookmakers adjust
- data becomes public
- models improve
- prices shorten
Your edge may shrink.
This is:
edge decay.
Track Edge Over Time
Do not simply calculate lifetime ROI.
Examine:
first 500 bets
next 500
most recent 500
If performance deteriorates, ask whether:
- the market changed
- your model changed
- data quality changed
- the original result was variance
Rolling Performance
Rolling measures can reveal changes more clearly than lifetime totals.
For example:
rolling 100-bet ROI
rolling 250-bet CLV
rolling calibration
These help identify whether an apparent advantage remains stable.
Price Availability Matters
You might calculate a theoretical edge using:
10.00.
But if you can only actually bet:
8.00
the edge changes.
Always test against prices you could realistically obtain.
This is particularly important when backtesting.
Do not give yourself:
the best bookmaker price that briefly appeared somewhere
unless your real betting process could consistently capture it.
Compare Bookmakers
Different bookmakers may offer different odds on the same horse.
Suppose:
Bookmaker A: 5.00
Bookmaker B: 5.50
Bookmaker C: 6.00
Your fair odds:
5.00
At Bookmaker A:
little or no estimated edge.
At Bookmaker C:
potentially meaningful value.
This is why price comparison matters.
Our Horse Racing Betting Websites guide covers the wider bookmaker market.
Best Odds Guaranteed and Edge
Best Odds Guaranteed can affect realised returns when applicable.
But do not build a theoretical edge purely around promotional benefits unless your historical analysis accurately models them.
Keep:
selection quality
and:
promotion impact
separate where possible.
Exchanges and Measuring Edge
Betting exchanges can provide another market benchmark.
Compare your probabilities with available back and lay prices.
Remember to account for:
commission.
A theoretical edge before commission may be much smaller after costs.
See our UK Betting Exchange Sites guide.
Staking Does Not Create an Edge
This deserves its own section.
A staking system cannot transform:
negative expected value
into:
positive expected value.
Changing stake size changes:
risk
and:
return distribution.
It does not magically improve the underlying bet.
Kelly Criterion
The Kelly Criterion for Horse Racing Betting links estimated edge to staking.
But Kelly assumes your probability estimates are meaningful.
If you overestimate your edge, Kelly can recommend stakes that are too aggressive.
Many bettors therefore use fractional Kelly.
Keep Edge and Stake Testing Separate
When testing a strategy, start by asking:
Does the selection method produce an edge?
Only then ask:
How should I stake it?
Otherwise, an aggressive staking system can make a mediocre strategy appear impressive during a favourable historical period.
Keep a Detailed Betting Record
You cannot measure your edge properly without data.
Your Horse Racing Betting Record should ideally include:
- date
- race
- selection
- odds taken
- closing odds
- stake
- result
- profit/loss
- model probability
- fair odds
- market probability
- estimated edge
- expected value
- strategy
- model version
That allows proper analysis later.
A Practical Edge Measurement Example
Suppose your model assesses:
Horse A: 28%
Bookmaker odds:
4.50
Raw implied probability:
22.22%.
After adjusting for the bookmaker margin, suppose your estimated market probability becomes:
21%.
Your probability
28%
Market probability
21%
Estimated probability edge
7 percentage points
Your fair odds
1 ÷ 0.28 = 3.57
Available odds
4.50
Estimated EV
0.28 × 4.50 = 1.26
Estimated EV:
+26%.
That looks strong.
But you should still ask:
Is my 28% estimate well calibrated?
Does this type of bet historically produce positive CLV?
Does the edge survive out-of-sample testing?
Can I actually obtain 4.50 consistently?
Is this result dependent on one model variable?
Only repeated evidence can answer those questions.
A Practical Edge Measurement Framework
For every potential bet:
1. Analyse the race
Assess form, pace, draw, going and relevant performance factors.
2. Estimate probability
Assign your win probability.
3. Convert to fair odds
Calculate your price.
4. Examine the market
Record available bookmaker and exchange prices.
5. Remove margin
Estimate the market’s margin-free probability.
6. Calculate disagreement
Compare your probability with the market.
7. Calculate EV
Determine the theoretical return at the available odds.
8. Place the bet only if it meets your rules
Avoid changing criteria because you like the horse.
9. Record the closing price
Measure CLV.
10. Record the result
Update your betting record.
11. Review large samples
Analyse calibration, CLV, ROI and drawdown.
12. Reassess
Determine whether the edge remains.
Warning Signs Your Edge May Not Be Real
Be cautious if:
☐ Profit comes from very few bets
☐ One winner creates most of the profit
☐ Backtest performance is excellent but live performance collapses
☐ Your biggest estimated edges perform worst
☐ You consistently obtain negative CLV
☐ Probabilities are badly calibrated
☐ Results disappear out of sample
☐ Small rule changes destroy profitability
☐ The strategy relies on unrealistic historical prices
☐ Costs have been ignored
☐ The model was repeatedly modified after seeing results
☐ Performance is concentrated in one short period
These do not automatically prove the strategy has no edge.
They indicate further investigation is required.
Signs Your Evidence Is Becoming Stronger
Evidence becomes more convincing when you see:
☐ Good probability calibration
☐ Positive CLV across large samples
☐ Positive results after realistic costs
☐ Out-of-sample profitability
☐ Performance across multiple periods
☐ Reasonable drawdowns
☐ Results that are not dependent on a handful of winners
☐ Similar performance in live betting and historical testing
☐ A logical explanation for why the edge exists
☐ Continued performance after the model is frozen
Again, none individually provides absolute proof.
Together they create a stronger body of evidence.
Common Mistakes When Measuring a Betting Edge
Treating Your Probability as Fact
It is an estimate.
Comparing Against Raw Bookmaker Probabilities
Account for overround.
Using ROI Alone
Short-term results contain variance.
Ignoring Closing Prices
CLV provides additional information.
Ignoring Calibration
Your probabilities need to behave like probabilities.
Using Tiny Samples
Small samples can produce extreme results.
Overfitting
Do not optimise endlessly against historical outcomes.
Ignoring Losing Runs
Every strategy has risk.
Assuming Bigger Estimated Edge Is Always Better
Huge disagreements can indicate model errors.
Ignoring Costs
Commission and price availability matter.
Changing the Model Constantly
You cannot properly test something that changes after every losing week.
Confusing Staking With Selection Edge
Staking determines exposure, not whether the underlying bet is good.
How Measuring Your Edge Fits Into the British Racecourses Betting Process
A structured analytical process looks like this:
Analyse the race
↓
How to Analyse a Horse Race Like a Professional
↓
Estimate probabilities
↓
↓
Understand the market
↓
Horse Racing Market Efficiency
↓
Remove bookmaker margin
↓
↓
Find value
↓
↓
Calculate expected value
↓
↓
Measure your estimated edge
↓
How to Measure Your Edge in Horse Racing Betting
↓
Compare with the closing market
↓
↓
Test the process
↓
How to Test a Horse Racing Betting Model
↓
Record the evidence
↓
↓
Manage risk
↓
Horse Racing Bankroll Management
This turns the vague idea of:
having an edge
into something measurable and testable.
Frequently Asked Questions
What is an edge in horse racing betting?
A betting edge exists when the available odds underestimate the genuine probability of the horse winning.
How do I calculate my betting edge?
One method is to compare your estimated probability with the market’s margin-free implied probability.
What is probability edge?
If you estimate a horse at 25% and the margin-free market estimate is 20%, your estimated probability edge is five percentage points.
Is a 5% probability edge good?
Potentially, but only if your probability estimate is reliable. An apparent 5% edge based on a poor model is not a genuine advantage.
Is edge the same as expected value?
No. Probability edge measures disagreement in probabilities. Expected value incorporates probability and the actual odds available.
Is edge the same as ROI?
No. Edge is an estimate of underlying advantage. ROI measures realised financial results.
How do I know whether my edge is real?
Look for evidence across large samples, including calibration, CLV, realistic ROI and out-of-sample performance.
Does positive ROI prove an edge?
No. Short-term positive ROI can result from variance.
Does positive CLV prove an edge?
Not alone, but consistent positive CLV can provide useful evidence that you are obtaining strong prices.
What is calibration?
Calibration measures whether your probability estimates correspond with actual outcome frequencies over large samples.
Why should I remove bookmaker overround?
Bookmaker odds contain margin. Removing it provides a cleaner estimate of the market’s underlying probabilities.
Can I measure an edge from Starting Price?
SP can provide a useful later-market benchmark, although it is not an objective measure of true probability.
How many bets do I need to prove an edge?
There is no universal number. Required sample size depends on odds, strike rate, variance and the size of the underlying advantage.
Are 100 bets enough?
Usually not for strong conclusions about a modest betting edge, particularly at larger average odds.
Can a betting model have a 20% edge?
It is possible for individual bets to show large estimated differences, but consistently finding very large edges in mature markets should prompt careful investigation.
Why do my biggest edges sometimes perform badly?
Large apparent edges may identify areas where your model is poorly calibrated rather than where the market is most wrong.
Should I compare my prices with bookmakers?
Yes. Your fair prices become more useful when compared with actual market prices.
Should I compare with betting exchanges?
Exchange prices can provide another useful market benchmark, particularly where liquidity is strong.
Can draw bias create an edge?
Potentially, if your interpretation of the draw improves probability estimates beyond what is already reflected in prices.
Can pace analysis create an edge?
Potentially. But identifying the likely pace is not enough. You need to determine whether the market has priced the tactical effect correctly.
Can sectional times create an edge?
They may reveal information hidden by finishing positions, but their usefulness must still be demonstrated through better probability estimates and prices.
Does Kelly Criterion increase my edge?
No. Kelly determines stake size based on an assumed edge. It does not create the underlying advantage.
Can staking systems create an edge?
No staking system can turn genuinely negative expected-value selections into positive expected-value bets.
What is edge decay?
Edge decay occurs when an advantage becomes smaller or disappears, potentially because markets adapt or information becomes more widely available.
Should I track edge over time?
Yes. Rolling CLV, ROI and calibration can help identify whether performance is improving or deteriorating.
What should I record for every bet?
At minimum, record selection, odds, stake, result and profit/loss. More advanced records should also include fair odds, model probability, market probability, estimated edge, EV and closing price.
What is the difference between estimated edge and proven edge?
Estimated edge is the difference suggested by your current analysis. Proven edge requires a much stronger body of evidence showing that the advantage persists across meaningful samples.
Summary
Measuring your edge in horse racing betting begins with a simple comparison:
Your probability
versus:
The market’s probability.
But that comparison is only the beginning.
If you estimate:
25%
and the margin-free market estimate is:
20%,
your apparent advantage is:
5 percentage points.
That does not mean you have proved a genuine 5-point edge.
Your probability is an estimate.
To build stronger evidence, measure:
fair odds
market probability
expected value
closing line value
ROI
calibration
sample size
drawdown
and:
performance over time.
The distinction to remember is:
Estimated edge ≠ proven edge.
Finding a difference between your opinion and the market is easy.
Demonstrating that your opinion is systematically better is much harder.
That is why serious analysis should follow a continuous process:
Estimate → Compare → Bet selectively → Record → Test → Review.
Use How to Price a Horse Race to create probability estimates.
Use Bookmaker Overround Explained to understand the margin inside market prices.
Use Expected Value to calculate the theoretical value of the available odds.
Use Closing Line Value to compare your prices with the later market.
Use How to Test a Horse Racing Betting Model to test whether the advantage survives proper validation.
And maintain a Horse Racing Betting Record so your conclusions are based on evidence rather than memory.
The objective is not to prove that every bet was correct.
It is to determine whether your decision-making process repeatedly identifies prices that are better than the probabilities justify.
That is what a genuine betting edge should ultimately mean.
18+. Gambling involves financial risk. Only bet with money you can afford to lose.