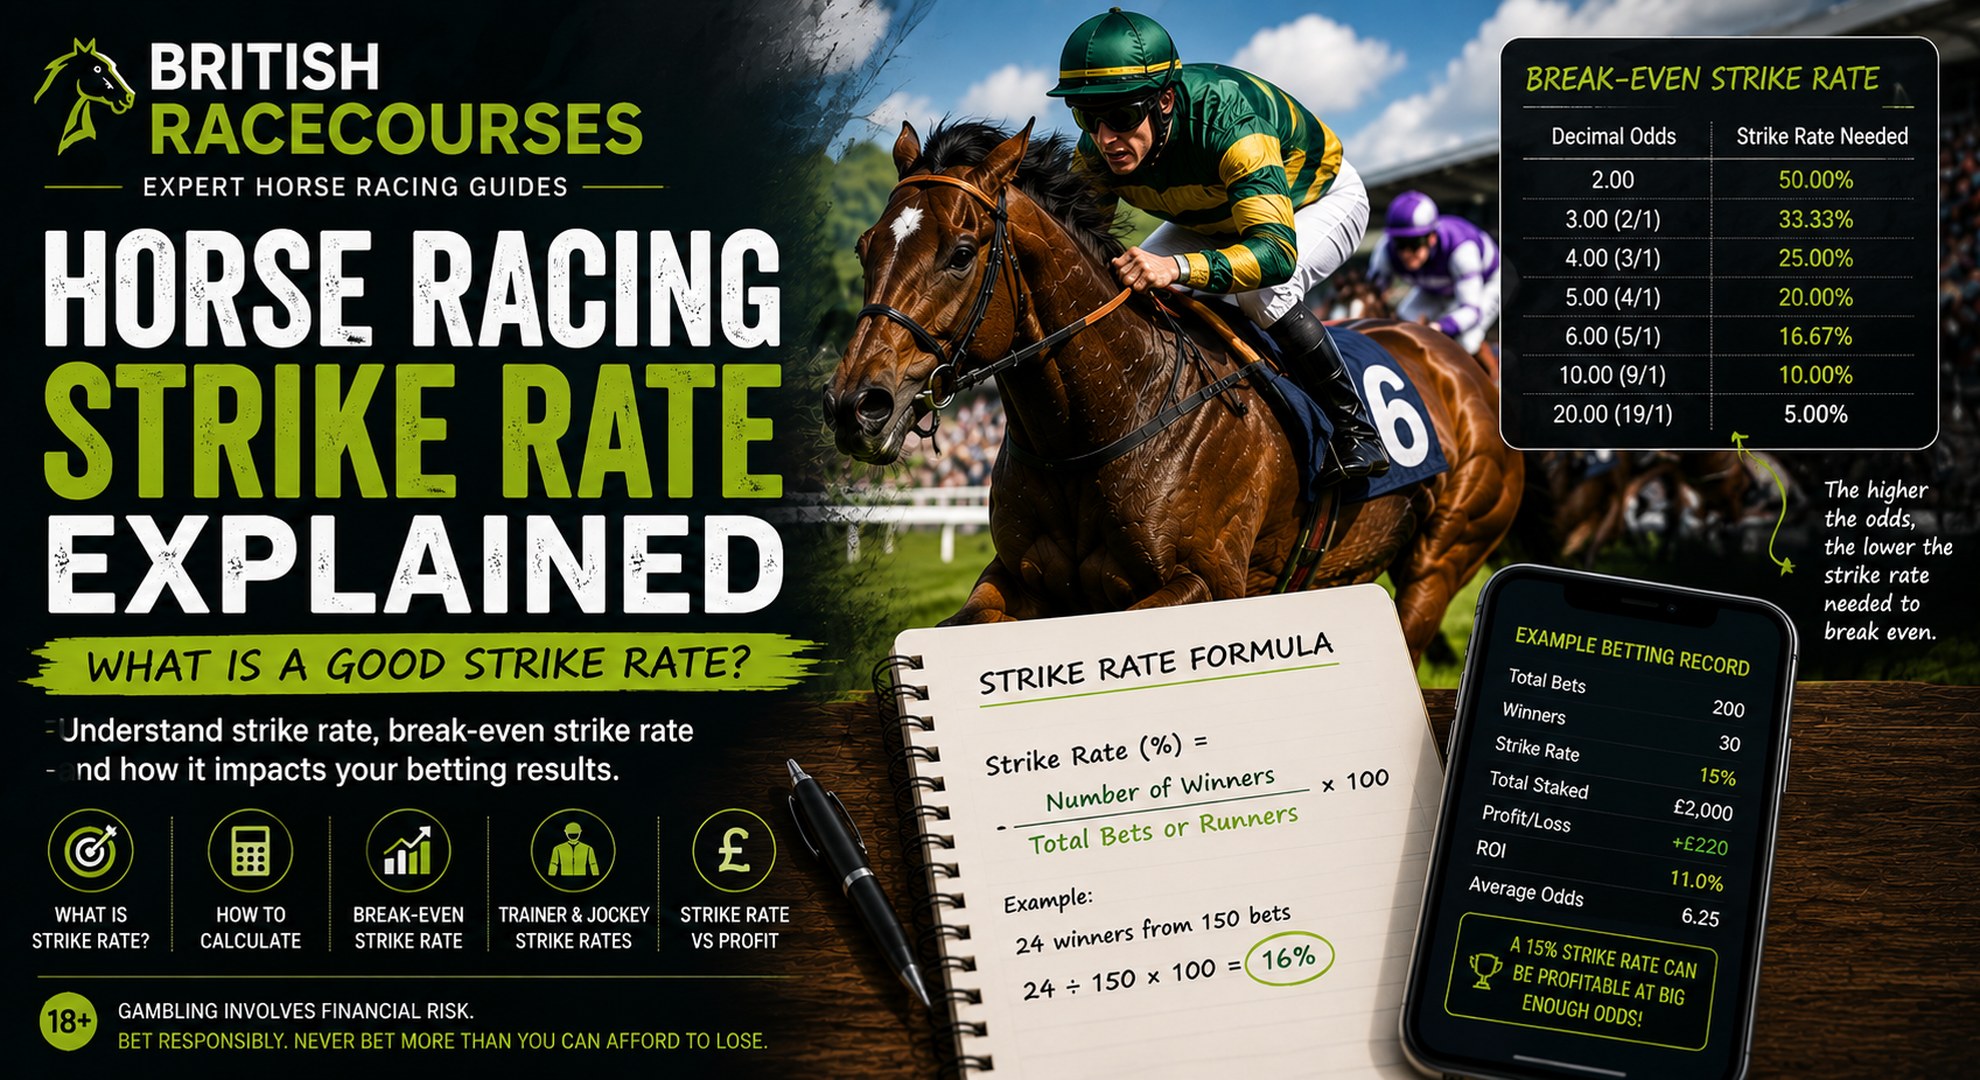
Strike rate in horse racing measures how often a horse, trainer, jockey, tipster or betting strategy wins.
The calculation is simple:
Strike Rate = Number of Winners ÷ Number of Runners or Bets × 100
If a trainer has 20 winners from 100 runners, the trainer has a 20% strike rate.
If you place 200 horse racing bets and 30 win, your betting strike rate is 15%.
Strike rate is one of the most commonly used statistics in horse racing because it provides an immediate measure of how frequently something succeeds.
It can also be misleading when viewed on its own.
A bettor with a 30% strike rate can lose money.
Another bettor winning only 10% of bets can make a profit.
A trainer with a 25% strike rate is not automatically more profitable to follow than one operating at 12%.
The missing variable is price.
Strike rate tells you how often something wins. It does not tell you whether the odds were good enough to make those winners profitable.
Understanding both sides is essential when using strike rates for horse racing analysis.
What Does Strike Rate Mean in Horse Racing?
Strike rate is the percentage of opportunities that result in a win.
The exact meaning depends on what you are measuring.
You can calculate the strike rate of:
- a horse
- a trainer
- a jockey
- a trainer and jockey combination
- a tipster
- a betting strategy
- your own bets
- favourites
- a specific racecourse angle
- horses within an odds range
- a racing system
The underlying calculation remains the same.
Wins ÷ Total Attempts × 100
If a jockey rides 250 horses and wins on 40:
40 ÷ 250 × 100
= 16% strike rate
If a trainer sends 80 runners to a particular racecourse and records 16 winners:
16 ÷ 80 × 100
= 20% strike rate
Strike rate makes records of different sizes easier to compare.
How to Calculate Horse Racing Strike Rate
Use:
Strike Rate (%) = Winners ÷ Total Bets or Runners × 100
Suppose your betting record contains:
Total bets: 150
Winners: 24
Calculation:
24 ÷ 150
= 0.16
0.16 × 100
= 16%
Your strike rate is:
16%
That means you have historically backed approximately 16 winners for every 100 bets.
It does not mean your next 100 bets will contain exactly 16 winners.
Strike rate is a historical measurement, not a guarantee about the next sample.
Horse Racing Strike Rate Calculator Example
Here are some simple examples:
| Winners | Bets/Runners | Strike Rate |
|---|---|---|
| 5 | 100 | 5% |
| 10 | 100 | 10% |
| 15 | 100 | 15% |
| 20 | 100 | 20% |
| 25 | 100 | 25% |
| 30 | 100 | 30% |
| 50 | 100 | 50% |
The calculation becomes more useful when you combine strike rate with average odds, profit/loss and return on investment.
What Is a Good Strike Rate in Horse Racing?
There is no single good horse racing strike rate.
A good strike rate depends heavily on the prices involved.
Consider two bettors.
Bettor A
Strike rate:
30%
Average winning odds:
2.50
Bettor B
Strike rate:
15%
Average winning odds:
8.00
Bettor A wins twice as frequently.
That does not automatically make Bettor A more profitable.
The higher prices achieved by Bettor B may more than compensate for the lower strike rate.
This is why asking:
“What is a good strike rate?”
without discussing odds gives an incomplete answer.
A useful strike rate is one that is sufficiently high relative to the prices you are taking.
Strike Rate and Odds
Odds determine the approximate strike rate required to break even before adjustments such as commission.
At decimal odds of 2.00, the implied probability is:
50%
At 3.00:
33.33%
At 4.00:
25%
At 5.00:
20%
At 6.00:
16.67%
At 10.00:
10%
These figures show why strike rates cannot be judged in isolation.
If you consistently back horses at 2.00 and win 40% of the time, a 40% strike rate sounds impressive but is insufficient at those prices.
If you consistently back horses at 10.00 and win 15% of the time, the lower strike rate may be much more valuable.
Break-Even Strike Rate in Horse Racing
Break-even strike rate is the percentage of bets you need to win at a given average price to avoid losing money before costs.
The basic formula using decimal odds is:
Break-Even Strike Rate = 1 ÷ Decimal Odds × 100
At decimal odds of:
2.00
Break-even strike rate:
1 ÷ 2
= 50%
At:
4.00
1 ÷ 4
= 25%
At:
10.00
1 ÷ 10
= 10%
If your actual strike rate exceeds the break-even rate at the prices you genuinely obtain, you may have an edge before other costs and complications.
If it falls below the break-even rate, you will generally lose over a sufficiently large sample under simple level-stakes assumptions.
Break-Even Strike Rate Table
| Decimal Odds | Fractional Equivalent | Break-Even Strike Rate |
|---|---|---|
| 1.50 | 1/2 | 66.67% |
| 2.00 | Evens | 50.00% |
| 2.50 | 6/4 | 40.00% |
| 3.00 | 2/1 | 33.33% |
| 4.00 | 3/1 | 25.00% |
| 5.00 | 4/1 | 20.00% |
| 6.00 | 5/1 | 16.67% |
| 7.00 | 6/1 | 14.29% |
| 8.00 | 7/1 | 12.50% |
| 9.00 | 8/1 | 11.11% |
| 10.00 | 9/1 | 10.00% |
| 11.00 | 10/1 | 9.09% |
| 13.00 | 12/1 | 7.69% |
| 17.00 | 16/1 | 5.88% |
| 21.00 | 20/1 | 4.76% |
This table is one of the simplest ways to judge whether a strike rate is meaningful.
What Strike Rate Do You Need at 2/1?
Fractional odds of:
2/1
equal decimal odds of:
3.00
Break-even strike rate:
1 ÷ 3
= 33.33%
You therefore need to win more frequently than approximately one bet in three to make a level-stakes profit at a constant 2/1 price before other costs.
What Strike Rate Do You Need at 5/1?
5/1 equals decimal:
6.00
Break-even:
1 ÷ 6
= 16.67%
You need approximately one winner from every six bets to break even.
A 20% strike rate at average odds of 5/1 would therefore be substantially more interesting than a 20% strike rate at average odds of 2/1.
What Strike Rate Do You Need at 10/1?
10/1 equals decimal:
11.00
Break-even:
1 ÷ 11
= approximately 9.09%
That means roughly one winner from every eleven bets is required to break even at a constant 10/1 under simplified level-stakes assumptions.
A bettor winning 12% at genuine average odds of 10/1 could therefore have a profitable record despite losing 88% of bets.
This demonstrates why a low strike rate is not necessarily bad.
Strike Rate Versus Profit
Strike rate measures frequency.
Profit measures financial performance.
They answer different questions.
Suppose two strategies make 100 £10 bets.
Strategy A
Winners:
30
Strike rate:
30%
Average winning decimal odds:
3.00
Total staked:
£1,000
Total returned:
30 × £10 × 3
= £900
Loss:
£100
Despite a 30% strike rate, the strategy loses money.
Strategy B
Winners:
15
Strike rate:
15%
Average winning decimal odds:
8.00
Total staked:
£1,000
Total returned:
15 × £10 × 8
= £1,200
Profit:
£200
Strategy B has half the strike rate but produces the better result.
This is why horse racing betting should be built around price and probability, not simply picking as many winners as possible.
Strike Rate Versus ROI
Return on investment, or ROI, measures profit relative to the amount staked.
The basic formula is:
ROI = Profit ÷ Total Staked × 100
Suppose:
Total staked:
£2,000
Profit:
£200
ROI:
£200 ÷ £2,000 × 100
= 10%
A bettor should normally track both:
Strike Rate: How often am I winning?
ROI: How much am I making or losing relative to what I stake?
Our guide to keeping and analysing horse racing betting records explains how to record these figures consistently.
Strike Rate and Expected Value
Expected value in horse racing betting provides the missing connection between strike rate and odds.
Suppose you estimate that a horse has:
25% chance of winning
Fair decimal odds:
1 ÷ 0.25
= 4.00
A bookmaker offers:
5.00
The available price implies:
20%
If your 25% probability estimate is accurate, the bet offers positive expected value.
Over a large sample of genuinely similar opportunities, you would expect a strike rate around 25%, not 50% or 75%.
The objective is not to maximise strike rate.
It is to identify occasions where your expected strike rate is better than the rate implied by the available price.
Strike Rate and Value Betting
This distinction sits at the heart of finding value bets in horse racing.
Imagine Horse A has:
70% chance of winning.
The available odds are:
1.20.
Horse B has:
20% chance of winning.
The available odds are:
8.00.
Horse A is much more likely to win.
That does not automatically make it the better bet.
A successful bettor is interested in whether the price compensates for the probability.
High strike rate and good value are different concepts.
Trainer Strike Rate Explained
Trainer strike rate measures the percentage of a trainer’s runners that win.
Formula:
Trainer Winners ÷ Trainer Runners × 100
Suppose a trainer has:
150 runners
30 winners
Strike rate:
30 ÷ 150 × 100
= 20%
A 20% strike rate means approximately one in five of the trainer’s runners has won during the measured period.
Trainer strike rates commonly appear on racecards and racing statistics pages.
What Is a Good Trainer Strike Rate?
There is no universal percentage that makes a trainer worth following.
Trainer strike rates depend on:
- quality of horses
- type of races targeted
- size of stable
- Flat or Jump racing
- handicaps versus non-handicaps
- class
- season
- racecourse
- age of horses
- market expectations
A powerful stable containing numerous short-priced horses should naturally achieve a higher strike rate than a smaller yard whose runners frequently start at double-figure odds.
Compare like with like.
Trainer Strike Rate and Profitability
A high trainer strike rate does not mean backing every runner from that stable will make money.
Suppose Trainer A has:
25% strike rate
but most winners start at short prices.
Trainer B has:
12% strike rate
but the market regularly underestimates the stable’s runners.
Trainer B could produce the better level-stakes return despite having fewer winners.
This is why trainer analysis should include:
- strike rate
- average odds
- actual/expected performance
- level-stakes profit or loss
- sample size
- race type
Strike rate is a starting point.
It is not a complete betting system.
Trainer 14-Day Strike Rate
Racecards frequently highlight recent trainer form.
A common window is the previous:
14 days
Suppose a trainer has:
5 winners from 20 runners
during the last fortnight.
Strike rate:
25%
That can indicate strong recent results.
But sample size matters.
Compare:
Trainer A:
1 winner from 2 runners
= 50%
Trainer B:
8 winners from 32 runners
= 25%
The 50% figure looks stronger.
It is based on only two runners.
Trainer B’s record provides considerably more evidence about the stable’s recent performance.
Trainer Strike Rate at a Racecourse
Course-specific trainer statistics can reveal interesting patterns.
Suppose a trainer’s overall strike rate is:
12%
At Chester, the trainer has:
20 winners from 100 runners
= 20%
That difference deserves investigation.
But do not immediately conclude that the trainer possesses a permanent Chester advantage.
Ask:
- how many seasons does the sample cover?
- what were the horses’ odds?
- were several runners short-priced favourites?
- which race types produced the winners?
- is the pattern still current?
- what is the level-stakes return?
Course strike rate becomes more useful when combined with context.
Trainer Strike Rate by Race Type
Headline statistics can hide substantial variation.
A trainer might record:
Overall strike rate: 15%
Two-year-olds: 25%
Handicaps: 10%
Novices: 22%
Chasers: 8%
First run after a break: 19%
This is why detailed statistics can be more useful than a single headline percentage.
The relevant question is not simply:
“What is this trainer’s strike rate?”
It is:
“What is this trainer’s strike rate under conditions comparable with today’s race?”
Jockey Strike Rate Explained
Jockey strike rate measures:
Jockey Winners ÷ Total Rides × 100
Suppose a jockey has:
400 rides
60 winners
Strike rate:
60 ÷ 400 × 100
= 15%
That tells you the jockey wins approximately 15% of rides over the measured sample.
Again, context matters.
What Is a Good Jockey Strike Rate?
A high jockey strike rate often reflects a combination of:
- riding ability
- quality of horses
- trainer relationships
- stable retainers
- race selection
- opportunities
Top jockeys frequently ride horses with strong winning chances.
A lower-profile jockey may spend much of the season riding outsiders.
Comparing their headline percentages without considering the horses they ride can therefore be misleading.
Jockey Strike Rate at Different Racecourses
Some riders develop strong records at particular tracks.
That can be relevant at distinctive courses where positioning and tactical judgement matter.
For example, riding around Chester Racecourse presents different challenges from riding the straight courses at Newmarket.
A course-specific jockey strike rate can therefore be worth examining.
But, as with trainer statistics, check:
- sample size
- average odds
- horse quality
- race types
- profitability
before assuming the jockey alone created the result.
Trainer and Jockey Combination Strike Rate
Trainer-jockey combinations can also be measured.
Suppose a trainer and jockey have combined for:
50 runners
12 winners
Strike rate:
12 ÷ 50 × 100
= 24%
That may look strong.
But you should still investigate the prices.
If most of those runners started favourite, 24% may actually be disappointing.
If they regularly started at 8/1 or bigger, the same percentage would be much more significant.
The market provides context for the raw statistic.
Horse Strike Rate
Individual horses also have strike rates.
Suppose a horse has raced:
20 times
and won:
5 races
Career strike rate:
25%
That can be useful, but horse strike rates require considerable context.
A horse may have accumulated several wins at lower levels before moving into stronger company.
Another might have a low career strike rate because it consistently contests high-quality races.
A handicapper can also have a modest win rate while being extremely consistent.
Use the horse’s strike rate alongside:
- current form
- handicap mark
- class
- distance
- going
- course
- pace
- draw
Our guide to reading horse racing form explains how these factors fit together.
Course and Distance Strike Rate
A horse’s record under specific conditions can be more relevant than its overall strike rate.
Suppose a horse has:
Career:
3 wins from 30
= 10%
At today’s course and distance:
3 wins from 6
= 50%
That is interesting.
It may suggest the track and trip suit the horse particularly well.
However, six races remain a small sample.
Do not treat 50% as the horse’s true probability of winning today.
Current opposition, form, weight, draw and price still matter.
Favourite Strike Rate in Horse Racing
Favourites win more frequently than randomly selected horses because the betting market identifies them as the most likely winner.
But favourite strike rate varies according to:
- race type
- field size
- price
- code
- class
- market competitiveness
A 4/6 favourite and a 7/2 favourite are both technically market leaders.
Their implied probabilities are very different.
Our guide to the favourite-longshot bias in horse racing explains why favourites, outsiders and market probabilities need to be analysed in price terms rather than labels alone.
Odds-On Favourite Strike Rates
Suppose a horse is:
1/2
Decimal odds:
1.50
Raw implied probability:
66.67%
A bettor should therefore expect a correctly priced 1.50 selection to lose approximately one race in three.
That is worth remembering.
The word favourite can create an impression of certainty that the mathematics does not support.
No normal horse racing price represents certainty.
Betting Strategy Strike Rate
Strike rate is particularly useful when analysing a repeatable betting method.
Suppose your strategy has produced:
500 bets
75 winners
Strike rate:
15%
Average odds:
8.00
Profit:
£600
Those figures together tell you considerably more than the 15% strike rate alone.
When evaluating a strategy, record:
- number of bets
- winners
- strike rate
- average odds
- average winning odds
- total staked
- profit/loss
- ROI
- maximum drawdown
- longest losing run
- closing prices
Strike Rate and Losing Runs
Lower strike-rate strategies naturally experience longer losing sequences.
A 50% strike-rate approach will generally produce fewer prolonged losing runs than a 10% strategy.
That does not automatically make the 50% strategy superior.
It does make the psychological and bankroll experience very different.
Our guide to betting variance in horse racing explains why losing runs are an inevitable part of probabilistic betting.
A 20% Strike Rate Means Plenty of Losers
Suppose your true long-term strike rate is:
20%
That also means approximately:
80% of bets lose
over a sufficiently large sample.
Winning one in five does not mean the wins arrive neatly:
loss
loss
loss
loss
win
They might arrive:
win
win
loss
loss
loss
loss
loss
loss
loss
win
Random variation creates clusters of both winners and losers.
A 10% Strike Rate Can Produce Long Losing Runs
A strategy operating around 10% will lose approximately nine bets out of ten over the long term.
Runs of:
10
15
20
or more consecutive losers should therefore not automatically be interpreted as proof that the strategy has stopped working.
Whether a losing run is statistically unusual depends on the expected strike rate and sample.
This is why horse racing bankroll management should account for the frequency of expected losses.
Strike Rate and Bankroll Size
Lower strike-rate betting generally requires greater tolerance for losing sequences.
Imagine two genuine positive-value strategies.
Strategy A:
Strike rate: 40%
Strategy B:
Strike rate: 8%
Strategy B may experience much greater swings even if its long-term expected return is excellent.
Using an oversized stake because the next winner feels “due” can destroy the bankroll before the long-term edge has a chance to emerge.
Strike rate therefore has practical implications beyond simply measuring success.
Strike Rate and the Kelly Criterion
The Kelly Criterion for horse racing uses your estimated probability and available odds to determine a theoretical stake.
Your probability estimate effectively represents an expected strike rate across comparable bets.
If you consistently overestimate that probability, Kelly staking can recommend stakes that are too large.
This is why probability quality matters more than a historical headline percentage.
Strike Rate and Probability Calibration
Suppose your model repeatedly identifies horses as having:
25% winning chances
Across a sufficiently large sample, those selections should win approximately one race in four if the probabilities are well calibrated.
If they win only:
15%
your model is overestimating their chances.
If they win:
35%
it may be underestimating them or the sample may contain substantial variance.
Our guide to horse racing probability calibration explains how to test these predictions properly.
Strike rate becomes much more powerful when compared with the strike rate you expected.
Actual Strike Rate Versus Expected Strike Rate
This is a useful distinction.
Suppose your bets had average estimated probability:
20%
Expected strike rate:
approximately 20%
After 1,000 bets:
Actual strike rate:
21.5%
That is broadly consistent.
Now suppose the actual strike rate is:
11%
Something is wrong.
Possibilities include:
- probability estimates are too high
- selection criteria have changed
- model inputs are flawed
- data contains errors
- sample is unusual
- market conditions changed
Comparing actual with expected strike rate can reveal problems that profit/loss alone may initially hide.
Strike Rate and Closing Prices
Suppose you back 100 horses at an average:
6.00
but they consistently start at:
4.50
Your short-term strike rate might still be poor.
However, consistently obtaining prices bigger than the later market may be useful evidence that your selection process is identifying value.
Our closing line value guide explains why price performance can provide information even before a large enough sample of race results has accumulated.
Strike rate and closing-price performance answer different questions.
Lay Betting Strike Rate
Strike rate requires different interpretation when lay betting in horse racing.
If you lay a horse, your bet normally wins when that horse loses.
You can therefore achieve extremely high strike rates by laying outsiders.
That does not automatically make the approach profitable.
Suppose you lay horses at:
11.00
A £10 lay creates:
£100 liability
You might win nine £10 lays and then lose £100 when the tenth horse wins.
Nine winning bets from ten:
90% strike rate
Financial result before commission:
£90 – £100
= £10 loss
This is a perfect example of why strike rate can be deceptive.
Lay Betting Break-Even Strike Rate
For a simple lay bet without commission, the required winning percentage rises as the lay odds increase.
At higher lay prices, the horse loses more frequently, so the lay bet wins more frequently.
But liability also rises.
This is why a 90% lay strike rate can be poor while a 55% lay strike rate at much shorter prices can potentially be more useful.
Always analyse:
- lay odds
- liability
- commission
- return on liability
- strike rate
together.
Each-Way Strike Rate
Each-way betting creates another complication.
An each-way selection can:
- win
- place without winning
- finish outside the places
You therefore need to distinguish:
win strike rate
from:
place strike rate
A tipster advertising a high each-way strike rate may be referring to selections reaching the places rather than actually winning.
Our guide to each-way value in horse racing explains why place terms and odds determine whether those results are genuinely valuable.
Tipster Strike Rate
Strike rate is commonly used to advertise horse racing tipping performance.
It can be useful.
But it should never be viewed alone.
If a tipster claims:
60% strike rate
ask:
- at what average odds?
- over how many bets?
- were selections recorded before racing?
- were realistic available prices used?
- what was the total profit?
- what was the ROI?
- what was the longest losing run?
A 60% strike rate based mainly on odds-on selections can be less impressive than a 20% strike rate at substantially bigger prices.
Why Sample Size Matters
Strike rates can move dramatically across small samples.
Suppose a trainer starts the month:
3 winners from 5 runners
Strike rate:
60%
After another 45 runners with 5 winners, the record becomes:
8 winners from 50
Strike rate:
16%
The initial 60% was mathematically correct.
It was not necessarily a reliable estimate of the trainer’s underlying success rate.
Small samples produce extreme percentages frequently.
Is 10 Runners Enough?
Usually not for drawing strong conclusions about an underlying strike rate.
A record of:
4 wins from 10
= 40%
could easily occur through short-term variance.
The quality of those ten opportunities also matters.
The same applies to:
- jockeys
- trainers
- betting systems
- course statistics
- trainer-jockey combinations
Treat small samples as information, not proof.
Is 100 Bets Enough to Judge Strike Rate?
One hundred bets are more informative than ten, but substantial uncertainty can remain, particularly with low strike-rate strategies.
Suppose a method is expected to win:
10% of bets.
Over only 100 bets, a small difference in winner count dramatically changes the observed percentage.
8 winners:
8%
12 winners:
12%
That represents a 50% increase in winners despite a difference of only four successful bets.
Larger samples provide more stable estimates.
Why You Should Segment Strike Rate
An overall figure can hide useful information.
Suppose your total betting strike rate is:
18%
Break it down.
By Odds
Below 3.00: 38%
3.00–5.99: 22%
6.00–9.99: 14%
10.00+: 6%
By Race Type
Handicaps: 14%
Non-handicaps: 25%
By Code
Flat: 20%
Jumps: 15%
By Racecourse
Different tracks may reveal further patterns.
This can help identify where your analysis is strongest and where apparent edges disappear.
Strike Rate by Odds Band
Odds bands are particularly important because the required winning rate changes with price.
Suppose your record shows:
| Odds Band | Actual Strike Rate | Approx. Break-Even Requirement |
|---|---|---|
| 1.50–1.99 | 60% | High |
| 2.00–2.99 | 43% | Moderate-high |
| 3.00–4.99 | 29% | Moderate |
| 5.00–9.99 | 17% | Lower |
| 10.00+ | 8% | Low |
Do not simply compare the actual percentages with one another.
Compare each with the prices actually taken.
A lower strike rate at bigger odds is expected.
How to Improve Your Horse Racing Strike Rate
Improving strike rate is not always the correct goal.
You could increase your strike rate immediately by backing more short-priced favourites.
That does not mean you would make more money.
A better objective is:
improve the quality of your probability estimates and betting decisions.
That can involve:
- better form analysis
- stronger price assessment
- improved race selection
- understanding pace
- studying draw
- considering going
- using sectional information
- removing weak betting angles
Our guide to analysing a horse race like a professional provides a structured process.
Strike Rate and Horse Racing Form
Form analysis can improve your estimate of a horse’s winning probability.
But do not simply count recent wins.
A horse with form:
111
has a 100% winning strike rate across those three races.
That does not mean it has anything close to a 100% chance today.
The horse may now face:
- stronger opposition
- a higher handicap mark
- different going
- different distance
- different pace
- a less favourable draw
Learning how to read a racecard helps place historical results in context.
Strike Rate and Draw Bias
A draw angle can also have a historical strike rate.
Suppose low-drawn runners have won:
25 of 100 comparable races
= 25%
That sounds useful.
But you need to know:
- how many low-drawn runners competed in each race?
- what prices did they start?
- were favourites disproportionately drawn low?
- did the course configuration change?
- does today’s pace setup match the historical sample?
Our horse racing draw guide explains why raw stall statistics need context.
Strike Rate and Pace Bias
The same principle applies to horse racing pace bias.
Suppose front-runners historically win 22% of comparable races.
That statistic means little without understanding how frequently horses attempt to lead and what prices those runners start.
Strike rate can describe a pattern.
It does not automatically establish value.
Strike Rate and Betting Models
A horse racing betting model should produce probabilities rather than simply trying to maximise the percentage of winners selected.
Imagine Model A correctly identifies the favourite in 40% of races.
Model B identifies winners in only 25%.
Model A appears better.
But if Model A consistently recommends horses at prices shorter than their true chances justify while Model B identifies overpriced runners, Model B could be considerably more useful for betting.
Predictive accuracy and profitability are related but not identical.
Strike Rate and Backtesting
When backtesting a horse racing betting system, record strike rate alongside profit.
A useful backtest should include:
- total selections
- winners
- strike rate
- average odds
- profit
- ROI
- drawdown
- losing runs
- performance by year
- performance by odds band
- performance by race type
A high historical strike rate is not enough.
The system needs to survive realistic prices, costs and out-of-sample testing.
Common Strike Rate Mistakes
Assuming Higher Is Always Better
A 50% strike rate can lose money.
A 10% strike rate can make money.
Price determines the difference.
Ignoring Odds
Strike rate without odds provides little information about betting value.
Using Tiny Samples
Three winners from five is technically 60%.
It is not strong evidence of a sustainable 60% underlying rate.
Comparing Different Types of Racing
Trainer records across different classes, codes and horse populations may not be directly comparable.
Ignoring Profitability
Winning frequently can still produce a financial loss.
Ignoring Losing Runs
Low strike-rate methods naturally create longer losing sequences.
Confusing Strike Rate With Probability
A historical 20% strike rate does not mean the next horse has exactly a 20% chance.
Ignoring Market Expectations
A trainer achieving 20% with heavily backed favourites may be less impressive from a betting perspective than a lower strike rate achieved with underestimated horses.
Chasing a Higher Strike Rate
Selecting shorter-priced horses simply to improve your winning percentage can reduce value.
Judging a Strategy Too Quickly
Short-term strike rate can deviate significantly from long-term expectations.
How to Analyse Your Own Betting Strike Rate
Start by keeping accurate records.
For every bet, record:
- date
- racecourse
- race
- horse
- odds taken
- stake
- result
- profit/loss
- bet type
- race type
- your estimated probability
Then calculate:
Overall Strike Rate
Winners ÷ Total Bets × 100
Strike Rate by Odds
Separate short-priced, mid-priced and bigger-priced selections.
Strike Rate by Race Type
Compare handicaps, maidens, novice races and pattern races where relevant.
Strike Rate by Code
Compare Flat and Jump betting if you bet on both.
Strike Rate by Racecourse
Look for meaningful differences.
Actual Versus Expected Strike Rate
Compare results with your probability estimates.
Strike Rate Versus ROI
Identify whether more frequent winners actually translate into better financial performance.
This produces a far more useful picture than a single headline percentage.
Frequently Asked Questions
What is strike rate in horse racing?
Strike rate is the percentage of runners, rides, selections or bets that win. Divide the number of winners by the total number of opportunities and multiply by 100.
How do you calculate horse racing strike rate?
Use:
Winners ÷ Total Runners or Bets × 100
If you have 20 winners from 100 bets, your strike rate is 20%.
What is a good strike rate for horse racing betting?
There is no universal good percentage. The required strike rate depends on the odds. A 15% strike rate can be excellent at large average odds and poor at short average odds.
Is a 20% strike rate good?
It depends on the prices. At average decimal odds of 6.00, 20% would exceed the basic 16.67% break-even rate. At average odds of 3.00, 20% would be insufficient.
Is a 30% strike rate good?
Again, it depends on odds. At 4.00, the basic break-even rate is 25%, so 30% would be strong under simplified assumptions. At 2.00, you would need 50% to break even.
What is the break-even strike rate at 2/1?
2/1 equals decimal odds of 3.00. The basic break-even strike rate is 33.33%.
What is the break-even strike rate at 5/1?
5/1 equals decimal odds of 6.00. The basic break-even strike rate is approximately 16.67%.
What is the break-even strike rate at 10/1?
10/1 equals decimal odds of 11.00. The basic break-even strike rate is approximately 9.09%.
What is trainer strike rate?
Trainer strike rate is the percentage of a trainer’s runners that win.
What is jockey strike rate?
Jockey strike rate is the percentage of a jockey’s rides that result in wins.
What is a good trainer strike rate?
It depends on the type and quality of horses a trainer handles, the races targeted and the period measured. Compare the figure with market prices, sample size and relevant peers rather than using one universal threshold.
What is a good jockey strike rate?
There is no single benchmark because jockeys receive very different riding opportunities. A high strike rate should be assessed alongside the quality and prices of the horses ridden.
Does a high strike rate mean a trainer is profitable to follow?
No. A trainer can have a high strike rate while producing a level-stakes loss if the winners start at prices that are too short.
Does a high betting strike rate mean you are profitable?
No. Profitability depends on both strike rate and odds.
Can a low strike rate be profitable?
Yes. A bettor backing larger-priced horses can be profitable with a relatively low strike rate if the winning prices sufficiently compensate for the losing bets.
How many bets do I need before my strike rate is reliable?
There is no fixed number. Larger samples provide more reliable estimates, while low-strike-rate strategies generally require particularly large samples before conclusions become stable.
Why does my strike rate change so much?
Short-term results are affected by normal variance. As the sample increases, the observed rate should generally become more informative about the underlying process.
Should I try to increase my strike rate?
Not necessarily. The objective in betting is not simply to maximise winners. Focus on finding prices that offer value relative to the probability of winning.
Summary
Strike rate is one of the simplest and most useful statistics in horse racing.
The calculation is:
Winners ÷ Total Runners or Bets × 100
It can measure the success frequency of:
- horses
- trainers
- jockeys
- tipsters
- betting systems
- individual bettors
But strike rate should never be analysed without price.
A 40% strike rate can lose money.
A 10% strike rate can make money.
The difference is the odds available on the winners and whether those prices accurately compensate for the probability of losing.
Break-even strike rate provides a useful benchmark:
1 ÷ Decimal Odds × 100
That gives approximately:
2.00 = 50%
3.00 = 33.33%
4.00 = 25%
5.00 = 20%
6.00 = 16.67%
10.00 = 10%
When analysing trainers and jockeys, add context including sample size, horse quality, race type, course and market prices.
When analysing your own betting, track strike rate alongside:
- average odds
- profit/loss
- ROI
- expected strike rate
- losing runs
- drawdown
- closing prices
The goal is not to achieve the highest strike rate.
The goal is to achieve a strike rate that is better than the prices you are taking require.
That distinction turns strike rate from a simple racing statistic into a useful tool for analysing betting performance.
18+. Gambling involves financial risk. Never bet more than you can afford to lose and never chase losses.