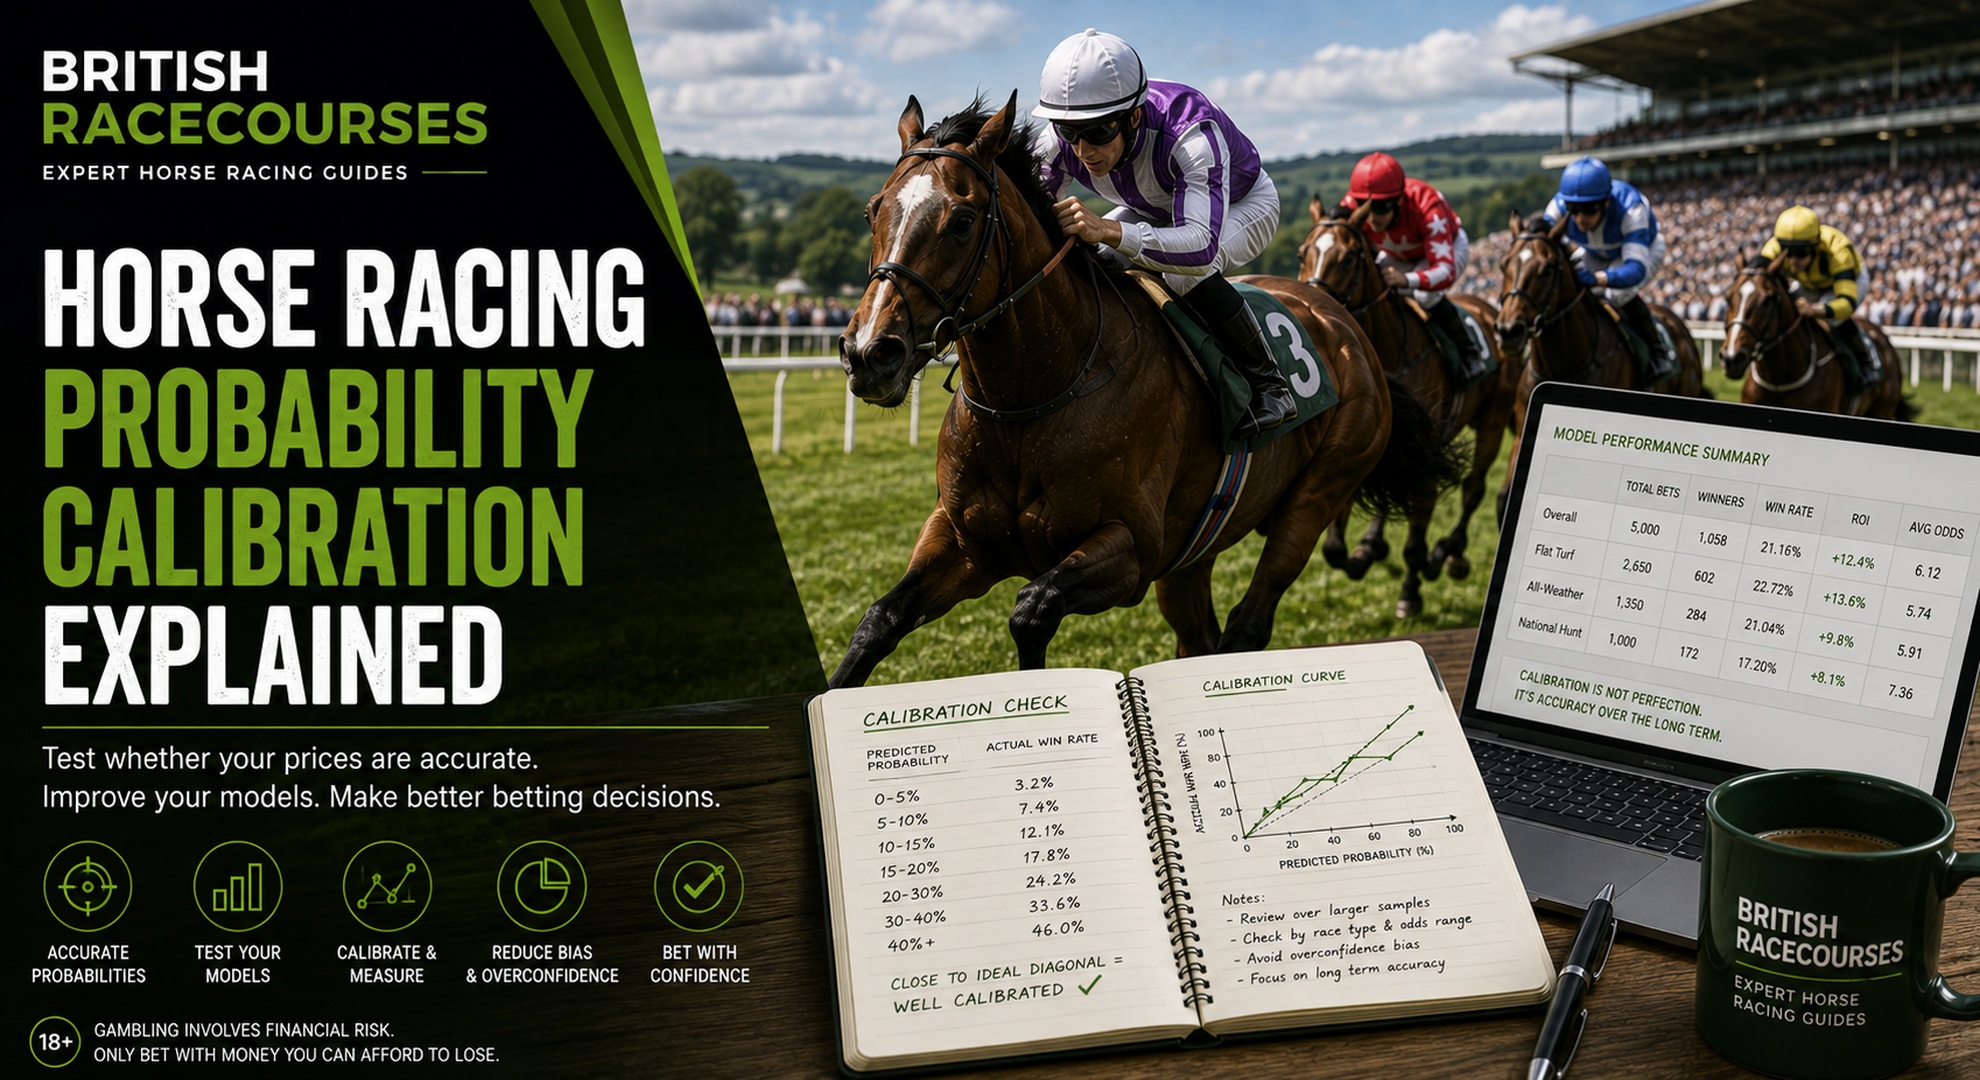
Estimating a horse has a 20% chance of winning is easy. Knowing whether your 20% estimates are genuinely accurate is much harder.
Probability calibration provides the test.
If you repeatedly give horses a 20% chance of winning, a well-calibrated approach should see roughly 20% of those horses win over a sufficiently large sample. If only 10% win, you have probably been too confident. If 30% win, you have probably underestimated their chances.
This matters because almost every serious approach to value betting ultimately depends on probability.
Your estimated probability determines your fair odds. Your fair odds determine whether the available bookmaker price represents value. Your perceived edge can influence whether you bet and, in some staking systems, how much you stake.
Poor probabilities can therefore undermine an otherwise impressive-looking betting strategy.
Probability calibration helps expose that problem.
What Is Probability Calibration in Horse Racing?
Probability calibration measures how closely your estimated probabilities correspond with what actually happens.
Imagine recording 500 horses that you assessed as having approximately a 20% chance of winning.
If about 100 win, your 20% estimates appear reasonably well calibrated.
If only 55 win, your estimates were too optimistic.
If 150 win, you were too pessimistic.
The principle can be expressed simply:
Predicted probability ≈ observed win rate
The comparison needs a substantial sample. A horse priced at a 20% probability losing today tells you almost nothing about the quality of the assessment.
It was expected to lose four times out of five.
Calibration becomes useful when you group hundreds or thousands of similar assessments and compare your predicted probabilities with the actual results.
Probability Is Not Prediction
One of the most important concepts in racing analysis is the difference between probability and prediction.
Suppose you assess a race and give four runners these chances:
| Horse | Estimated Win Probability | Fair Decimal Odds |
|---|---|---|
| Horse A | 45% | 2.22 |
| Horse B | 30% | 3.33 |
| Horse C | 15% | 6.67 |
| Horse D | 10% | 10.00 |
Horse D wins.
Was your analysis wrong?
Not necessarily.
You gave Horse D a 10% chance, not a 0% chance. An outcome with a 10% probability should occur roughly once every ten comparable opportunities.
Judging a probability forecast by whether one individual result was correct is therefore misleading.
The same principle applies when you analyse a horse race. Racing contains uncertainty. Good analysis attempts to estimate that uncertainty rather than eliminate it.
Why Calibration Matters for Horse Racing Betting
Calibration matters because betting decisions are based on the relationship between probability and price.
Suppose you estimate a horse’s winning probability at:
25%
That corresponds to fair decimal odds of:
1 ÷ 0.25 = 4.00
Equivalent fractional odds are approximately:
3/1
A bookmaker offers 5/1.
That appears attractive because your assessment suggests the horse should be shorter.
But suppose your supposedly 25% selections actually win only 15% of the time.
A 15% probability corresponds to fair decimal odds of:
6.67
Your apparent 5/1 value bet may therefore have been poor value.
The arithmetic was correct.
The input probability was wrong.
This is why learning how to price a horse race is only the beginning. You also need to determine whether the probabilities behind those prices stand up to evidence.
Calibration and Value Betting Are Closely Connected
Value betting depends on estimating when the available odds are greater than the true chance of an outcome warrants.
A simple expected-value calculation can be represented as:
Expected value = probability × decimal odds
Suppose:
Estimated probability = 25%
Available odds = 5.00
The calculation is:
0.25 × 5.00 = 1.25
That represents a theoretical positive expectation before considering other practical factors.
But change the true probability to 18%:
0.18 × 5.00 = 0.90
The apparent edge disappears.
This is why our guide to expected value in horse racing betting and probability calibration belong together.
Expected value is only as reliable as the probability estimate used to calculate it.
What Does a Well-Calibrated Horse Racing Model Look Like?
Imagine you have recorded 5,000 model predictions.
You group them into probability bands and obtain the following results:
| Predicted Probability | Number of Horses | Actual Win Rate |
|---|---|---|
| 0-5% | 1,200 | 3.1% |
| 5-10% | 1,100 | 7.2% |
| 10-15% | 900 | 12.4% |
| 15-20% | 650 | 17.1% |
| 20-30% | 600 | 24.2% |
| 30-40% | 350 | 34.0% |
| 40%+ | 200 | 45.5% |
Those figures would look encouraging.
The actual strike rates are reasonably close to the predicted probability ranges.
You should not expect perfect alignment. Horse racing contains substantial variance, and smaller samples will produce considerable noise.
The objective is not mathematical perfection.
You are looking for systematic differences between what you predict and what actually occurs.
What Is Overconfidence?
Overconfidence occurs when your estimated probabilities are consistently higher than the observed results justify.
Suppose your records show:
| Your Estimate | Actual Win Rate |
|---|---|
| 10% | 7% |
| 20% | 13% |
| 30% | 20% |
| 40% | 28% |
| 50% | 36% |
The pattern is clear.
Your analysis is repeatedly assigning too much probability to selections.
This is more important than one losing run or a poor month because it suggests a structural problem with the way you assess races.
Overconfidence is particularly dangerous when combined with aggressive staking.
If you believe a horse has a 40% chance when its genuine chance is nearer 28%, you may see a substantial betting edge that does not actually exist.
What Is Underconfidence?
Underconfidence is the opposite problem.
Your probabilities may consistently be too conservative.
For example:
| Your Estimate | Actual Win Rate |
|---|---|
| 10% | 14% |
| 20% | 26% |
| 30% | 37% |
| 40% | 48% |
This suggests your estimates are not giving strong contenders enough probability.
Underconfidence may cause you to miss legitimate betting opportunities because your fair prices are too big.
It can also indicate that your probability distribution is too flat, with too much probability allocated to outsiders and too little allocated to the strongest runners.
The Favourite-Longshot Problem
Horse racing markets do not necessarily behave identically across every odds range.
Long-priced runners and favourites can display different relationships between market probability and actual outcomes.
This is one reason we created a separate guide to the favourite-longshot bias in horse racing.
Calibration analysis should therefore examine different probability and odds bands rather than simply calculating one overall number.
A model could be well calibrated around 3/1 to 8/1 but badly calibrated on runners priced at 20/1 or bigger.
That distinction could be hidden by an overall result.
Use Odds Bands as Well as Probability Bands
Your existing British Racecourses odds resources can also provide useful reference points when reviewing probability ranges.
For example, decimal probability equivalents include approximately:
| Fractional Odds | Implied Probability |
|---|---|
| Evens | 50.0% |
| 2/1 | 33.3% |
| 3/1 | 25.0% |
| 5/1 | 16.7% |
| 10/1 | 9.1% |
| 20/1 | 4.8% |
British Racecourses has individual explanations for common prices such as 2/1 odds, 3/1 odds, 5/1 odds and 20/1 odds.
Grouping results by both your estimated probability and the actual market odds can reveal where your judgement differs most from the market.
How to Create a Calibration Table
You do not need sophisticated software to start testing calibration.
A spreadsheet is enough.
Record at least:
- race date
- racecourse
- horse
- your estimated probability
- your fair odds
- available bookmaker odds
- price taken
- starting price or closing price
- finishing result
- win or loss
You can then group selections into probability bands.
For example:
0-4.99%
5-9.99%
10-14.99%
15-19.99%
20-24.99%
25-29.99%
30-39.99%
40-49.99%
50%+
For every group, calculate:
Number of predictions
Number of winners
Actual win percentage
Then compare the actual win percentage with the average predicted probability.
Our guide to keeping and analysing horse racing betting records explains how to build the wider record from which this analysis can be produced.
Use the Average Predicted Probability
Probability bands are useful, but do not compare the result with the midpoint blindly.
Suppose your 20-25% group contains:
21%, 21%, 22%, 22%, 23%, 23%, 24%, 24%, 24%, 25%.
The average may be approximately 22.9%.
That is the number you should compare with the observed win rate.
If 23.1% of a large sample actually wins, calibration looks extremely close.
If 14% wins, you have a substantial discrepancy.
Example of a Calibration Test
Suppose you have recorded 1,000 selections.
Two hundred were given probabilities between 20% and 25%.
Their average estimated probability was:
22.4%
There were:
31 winners
Observed win rate:
31 ÷ 200 = 15.5%
Your average prediction was 22.4%, but the actual result was 15.5%.
That is a meaningful warning.
Your model or judgement appears overconfident within this probability range.
Do not immediately change everything after one test, though.
First investigate whether the sample is sufficiently large and whether another variable explains the discrepancy.
Sample Size Matters
Calibration cannot eliminate statistical variance.
Suppose you assess ten horses at exactly 20%.
You might reasonably see:
0 winners
1 winner
2 winners
3 winners
or more.
Two winners would produce the expected 20% strike rate, but getting exactly two is not required for the original probability to have been sensible.
Increase the sample to 1,000 comparable predictions and the results become more informative.
This is the same reason short-term profit can mislead bettors.
Our guide to betting variance in horse racing explains why results can move substantially around their underlying expectation.
Calibration should therefore be judged over large datasets rather than a handful of races.
Do Not Calibrate Using Only Your Bets
This is an important distinction.
If you create probabilities for every runner but only bet when your perceived edge exceeds a particular threshold, analysing only your bets gives you an incomplete picture.
You should ideally record the probabilities for every runner you price.
Why?
Because calibration measures your ability to estimate probability, not merely the performance of your betting selections.
Your 10-20% assessments may be excellent while your 30-40% assessments are poor.
You will not discover that if you only save horses that trigger bets.
Test Different Race Types
An overall calibration figure can hide important weaknesses.
Split your results by race type where the sample permits.
Possible categories include:
- Flat turf
- all-weather
- National Hunt
- handicaps
- non-handicaps
- novice races
- maiden races
- two-year-old races
- large fields
- small fields
- sprints
- staying races
British racing varies enormously between these environments.
A model that works well in established handicaps may struggle in races containing lightly raced horses.
Likewise, your analysis of an all-weather racecourse may rely on different variables from your assessment of National Hunt racing.
Do not assume one calibration profile applies universally.
Test Calibration by Racecourse
Racecourse-specific analysis can also uncover weaknesses.
British courses differ considerably in configuration, surface, gradients, turns and draw effects.
A bettor may systematically underestimate how important course suitability is at one venue while overestimating it elsewhere.
Your records might show good overall calibration but poor results at particular courses.
This is where the broader British Racecourses database becomes valuable.
For example, analysis at Newmarket involves very different course characteristics from racing at Cheltenham.
Do not automatically alter your method because one course produces an unusual result. Ensure you have enough observations first.
Test Calibration by Odds Range
Separate your estimates into market-price bands as well.
For example:
Odds-on
Evens to 3/1
Above 3/1 to 8/1
Above 8/1 to 16/1
Above 16/1 to 33/1
Above 33/1
You may discover that your assessment is reasonably accurate around the front of the market but consistently overestimates outsiders.
That information is far more actionable than simply knowing your model’s overall strike rate.
Test Calibration by Field Size
Field size changes the structure of a race.
Compare:
- 2-7 runners
- 8-11 runners
- 12-15 runners
- 16+ runners
Large handicaps contain more possible outcomes and often more complex interactions involving pace, traffic and draw.
Your probabilities may become increasingly overconfident as field size rises.
Again, you need enough observations before drawing conclusions.
Calibration and Horse Racing Ratings
Ratings are not automatically probabilities.
This distinction matters.
A horse with a rating of 100 does not have a 100% chance of winning.
A speed figure of 90 is not a 90% probability.
Ratings rank or quantify aspects of performance. They still need to be translated into probabilities if you want to use them directly for pricing.
British Racecourses covers several established rating concepts, including Racing Post Ratings and top speed ratings.
A sophisticated ratings approach can identify strong runners while still producing poor betting probabilities if the conversion from rating difference to win chance is badly calibrated.
Calibration and Your Betting Model
Probability calibration becomes particularly important when building a quantitative model.
A model might rank horses extremely well while producing poor probability estimates.
These are different skills.
Suppose a model consistently places the winner among its top two rated horses.
That sounds impressive.
But if it gives its top-rated horse a 60% winning probability when those horses actually win 38% of the time, the probability output is unreliable.
That matters enormously for betting because the perceived value depends on the magnitude of the probability.
Our guide to building a horse racing betting model explains the wider modelling process.
Calibration is one test within that process, not a substitute for it.
Calibration Does Not Tell You Everything
A perfectly calibrated model is not automatically profitable.
This is critical.
Imagine a model simply reproduces market probabilities extremely accurately.
Its calibration could be excellent.
But if it never identifies prices that are better than the market, there may be no exploitable betting edge.
Conversely, a model might identify useful ranking information while needing its probability estimates recalibrated.
Calibration answers:
“Do probabilities of X% occur approximately X% of the time?”
It does not independently answer:
“Can I beat the betting market?”
You need other evidence.
Compare Your Probabilities With the Market
One useful benchmark is the market itself.
Convert bookmaker prices into implied probabilities and compare those estimates with yours.
Remember that bookmaker odds contain a margin, so simply adding the raw implied probabilities will usually produce a total above 100%.
If you are comparing a complete race book, remove or account for the margin before treating bookmaker odds as fair probabilities.
The comparison can then reveal whether your model genuinely adds information.
If your estimates repeatedly differ substantially from the market and the market proves better calibrated, your method needs attention.
If your probabilities outperform the market in particular situations across large out-of-sample datasets, that is much more interesting.
Closing Prices Provide Another Benchmark
The final market price contains information accumulated from many participants.
That makes closing prices useful when assessing your own betting decisions.
Suppose you repeatedly back horses at:
6/1
and they close at:
9/2
You are consistently obtaining a bigger price than the eventual market price.
That does not guarantee profit, but it is useful information.
This concept is explored fully in our guide to closing line value in horse racing.
Calibration and closing-line analysis answer different questions.
Calibration asks whether your probability estimates match outcomes.
Closing-line analysis asks how your taken prices compare with the later market.
Together they provide considerably more information than profit alone.
Bookmaker Prices Matter
If your analysis identifies genuine value, obtaining the strongest available price remains important.
A horse might be:
9/2 with one bookmaker
5/1 with another
11/2 elsewhere
Your probability assessment does not change, but the expected value of the bet does.
This is why serious bettors often compare horse racing bookmakers rather than accepting the first available price.
British Racecourses also compares the wider market through our horse racing betting sites and horse racing betting apps resources.
Calibration helps assess your opinion.
Price comparison helps you obtain the strongest available terms when you decide to bet.
Best Odds Guaranteed Can Affect Recorded Returns
Settlement rules also matter when reviewing historical betting performance.
A bet placed under Best Odds Guaranteed terms may settle at a larger SP than the price originally taken.
That can improve realised returns.
Do not confuse this with improved probability calibration.
Your probability forecast remains the same regardless of how the bookmaker ultimately settles the winning bet.
Keep probability accuracy and betting returns as separate measures.
Calibration and Draw Analysis
Breaking calibration down by analytical variable can uncover where your assumptions fail.
The horse racing draw provides a good example.
Suppose your model gives a large adjustment to low-drawn runners at certain tracks.
If those adjusted probabilities consistently overestimate their actual win rate, your draw factor may be too aggressive.
The same principle applies to almost every variable used in racing analysis.
Calibration and Pace
Pace can materially change how a race develops.
Our guides to horse racing pace bias and reading pace maps explain how running styles and expected race shape can influence analysis.
Calibration can test whether your pace adjustments are improving your probabilities.
If horses receiving large positive pace adjustments consistently underperform their estimated chances, you may be placing too much weight on projected race shape.
Calibration and Going
Going is another variable bettors can overweight or underweight.
A horse with proven soft-ground form may deserve a probability adjustment when conditions turn testing.
The difficult question is how large that adjustment should be.
Calibration does not tell you the answer immediately, but historical records can reveal whether your probability changes have been systematically excessive.
The same process can be applied to course form, distance, trainer form, jockey bookings, headgear and other variables.
Use Historical Backtesting Carefully
Calibration can be measured during a backtest, but historical testing creates risks.
Do not use future information when generating past probabilities.
If your model is being tested on a race from June 2024, every variable used to create that probability should have been knowable before that race.
Otherwise you introduce data leakage.
Our guide to backtesting a horse racing betting system covers this problem in detail.
A beautifully calibrated backtest means little if the model had access to information that would not have existed when the decision was made.
In-Sample Calibration Can Mislead
Do not judge calibration solely on the same races used to create your model.
A model can be adjusted until its historical probabilities fit past results extremely closely.
That does not mean it will perform similarly on new races.
Separate your data into:
Training data
Used to build the model.
Validation data
Used to make controlled development decisions.
Test or out-of-sample data
Used to evaluate performance on unseen races.
The final test is whether calibration survives outside the data used to construct the system.
What Is a Calibration Curve?
A calibration curve provides a visual representation of predicted probability against observed probability.
The horizontal axis shows:
Predicted probability
The vertical axis shows:
Actual win rate
Perfect calibration would broadly follow a diagonal line.
If the curve consistently falls below that line, the model tends to be overconfident.
If it sits above it, the model tends to be underconfident.
Real racing data will rarely create a perfectly smooth line because outcomes contain noise.
Look for persistent patterns rather than cosmetic perfection.
What Is a Brier Score?
The Brier score is one method of measuring the accuracy of probabilistic predictions.
For a simple win outcome:
- a winner is recorded as 1
- a loser is recorded as 0
- your predicted probability is compared with that result
- the squared difference is calculated
For an individual prediction:
Brier score = (forecast probability – actual outcome)²
Lower scores are better.
Suppose you give a horse a 70% chance and it wins:
(0.70 – 1)² = 0.09
If you give it a 20% chance and it wins:
(0.20 – 1)² = 0.64
The second forecast receives a much larger penalty.
Brier scores are useful because they assess the quality of probabilistic forecasts rather than merely counting winners.
They should still be interpreted alongside calibration tables, market comparisons and other performance measures.
Calibration Versus Strike Rate
Strike rate tells you:
How often did my selections win?
Calibration tells you:
Did they win as often as my probabilities said they should?
These are not the same question.
A strategy backing short-priced favourites might have a 55% strike rate but poor calibration.
Another strategy targeting bigger prices might win only 15% of the time while being exceptionally well calibrated.
Strike rate alone tells you nothing about whether the probabilities were appropriate.
Calibration Versus ROI
ROI measures financial performance relative to stakes.
Calibration measures probability accuracy.
A model can have:
good calibration + poor ROI
or:
poor calibration + short-term positive ROI
The second situation is particularly dangerous.
A few large-priced winners can make a badly calibrated strategy look highly profitable over a small sample.
This is why serious analysis should not rely on profit alone.
Calibration Versus Accuracy
Traditional prediction accuracy can also be misleading.
Suppose you simply predict that every horse will lose.
In a 12-runner race, you would be correct about 11 horses and wrong about one.
Your raw classification accuracy would look excellent.
It would also be useless for betting.
Horse racing requires probabilistic thinking.
The important question is not merely whether an outcome happened.
It is whether the probability assigned to that outcome was sensible.
Should the Probabilities in a Race Add Up to 100%?
For a mutually exclusive win market, your estimated win probabilities across every runner should total approximately:
100%
If you price:
Horse A 40%
Horse B 30%
Horse C 20%
Horse D 15%
the total is:
105%
You have created your own overround.
That means the probabilities are internally inconsistent as fair win probabilities.
Conversely, a total of 85% means 15 percentage points of winning probability have effectively disappeared.
Check your race-level totals before testing long-term calibration.
Do Not Constantly Recalibrate After Losing Runs
A poor run does not automatically mean your probabilities are wrong.
Suppose a well-tested group expected to win 25% of the time experiences only three winners from its next 25 selections.
That is uncomfortable.
It is not enough evidence by itself to rebuild the model.
Constantly changing a system in response to normal randomness creates another form of overfitting.
Set review intervals before you see the results.
For example:
Review every 500 predictions
rather than:
Review whenever I have a bad week
That keeps the process more objective.
Keep Model Versions Separate
If you change your probability method, start tracking the new version separately.
Do not mix:
Model 1.0
Model 1.1
Model 2.0
into one calibration dataset without identifying which predictions came from which version.
Otherwise you cannot tell whether the modification improved anything.
This principle also applies to manual bettors.
If you fundamentally change how you assess draw, pace, ratings or trainer form, record when that change occurred.
Use Calibration to Improve Decisions, Not Rewrite History
Calibration should identify weaknesses in your process.
It should not become a tool for endlessly modifying historical rules until the past looks perfect.
Suppose your 20-30% horses underperform.
Investigate why.
Perhaps you:
- overrate recent winners
- give too much weight to speed figures
- underestimate field strength
- overvalue favourable draws
- underestimate pace pressure
- treat uncertain form too confidently
- misjudge lightly raced horses
- assign too much weight to trainer form
Form a hypothesis.
Test it on new or unseen data.
Do not simply add filters until historical results improve.
A Practical Probability Calibration Workflow
A disciplined process could look like this:
1. Price every runner
Create your probability estimates before looking at the final outcome.
2. Make probabilities total approximately 100%
Check the complete race.
3. Record the predictions
Save every runner, not merely your bets.
4. Record market prices
Include the price available when you made the decision and preferably a later market benchmark.
5. Record results
Mark winners and losers consistently.
6. Build probability bands
Group comparable predictions.
7. Calculate average forecast probability
Do not rely solely on the band midpoint.
8. Calculate actual win percentage
Compare expectation with reality.
9. Segment the results
Check race type, odds range, field size and other meaningful categories.
10. Investigate persistent discrepancies
Look for systematic overconfidence or underconfidence.
11. Test modifications out of sample
Never assume a historical improvement will continue.
12. Continue recording
Calibration is an ongoing measurement process.
Probability Calibration Checklist
Before trusting probability estimates, ask:
- Do my probabilities total approximately 100% for each win market?
- Am I recording every priced runner?
- Do I have a sufficiently large sample?
- Does predicted probability broadly match actual win rate?
- Am I consistently overconfident?
- Am I consistently underconfident?
- Does calibration change across odds ranges?
- Does it change across race types?
- Does field size matter?
- Are particular racecourses causing problems?
- Are my ratings being confused with probabilities?
- Have I compared my estimates with market probabilities?
- Am I tracking closing prices?
- Have I separated training and testing data?
- Have I avoided future-information leakage?
- Am I keeping different model versions separate?
- Am I judging probability independently from profit?
- Have I allowed for normal betting variance?
If you cannot answer these questions, you probably do not yet know how reliable your probability estimates are.
Frequently Asked Questions
What does probability calibration mean in horse racing?
Probability calibration measures whether estimated probabilities correspond with actual results. If horses repeatedly assessed at around 20% win approximately 20% of the time over a large sample, those estimates appear reasonably calibrated.
Is a calibrated horse racing model profitable?
Not necessarily. Calibration measures probability accuracy, not profitability. A model could accurately reproduce market probabilities without finding enough mispriced betting opportunities to generate a profit.
How many bets do I need to test calibration?
There is no universal minimum. Larger samples provide more reliable evidence, particularly for low-probability horses. Testing all priced runners rather than only bets can build useful samples more quickly.
Can I test my own tissue prices?
Yes. Record your estimated probability for every runner before the race and compare groups of similar probabilities with their eventual win rates.
What is overconfidence in a betting model?
Overconfidence occurs when predicted probabilities are systematically higher than observed outcomes justify. Horses repeatedly assessed at 30% might, for example, win only around 20% of the time.
What is underconfidence?
Underconfidence occurs when outcomes happen more frequently than your probabilities predict. It can indicate that your probability distribution is too conservative.
Are horse racing ratings probabilities?
No. Ratings can help rank or compare horses, but a rating does not automatically represent a percentage chance of winning.
Should probabilities for every horse add up to 100%?
For a fair win market with mutually exclusive outcomes, the estimated probabilities should total approximately 100%.
Is strike rate the same as calibration?
No. Strike rate measures how often selections win. Calibration compares how often they win with how often your probabilities predicted they would win.
Is ROI a calibration measure?
No. ROI measures financial returns. A strategy can make a short-term profit while having badly calibrated probabilities, particularly if a few large-priced winners distort the result.
Can bookmakers’ odds be used as probabilities?
Odds can be converted into implied probabilities, but bookmaker prices contain a margin. You should account for that margin when using the market as a probability benchmark.
Should I change my model after a losing run?
Not automatically. Losing sequences are inevitable in horse racing. Changes should be based on sufficiently large samples and persistent evidence rather than short-term results.
Summary
Probability calibration answers one of the most important questions in serious horse racing analysis:
Are your estimated chances actually as accurate as you think they are?
If you repeatedly assign horses a 20% chance, approximately one in five should win over a sufficiently large and representative sample.
If they do not, investigate the discrepancy.
Good calibration does not guarantee betting profits. It does something more fundamental: it tells you whether the probabilities driving your decisions deserve confidence.
That makes calibration particularly valuable when combined with race pricing, expected value, market comparison, closing-line analysis, disciplined record keeping and realistic backtesting.
The objective is not to predict every winner.
It is to estimate uncertainty accurately enough to make better-informed decisions when the available betting price differs from your assessment.
18+. Gambling involves financial risk. Never bet more than you can afford to lose and never chase losses.