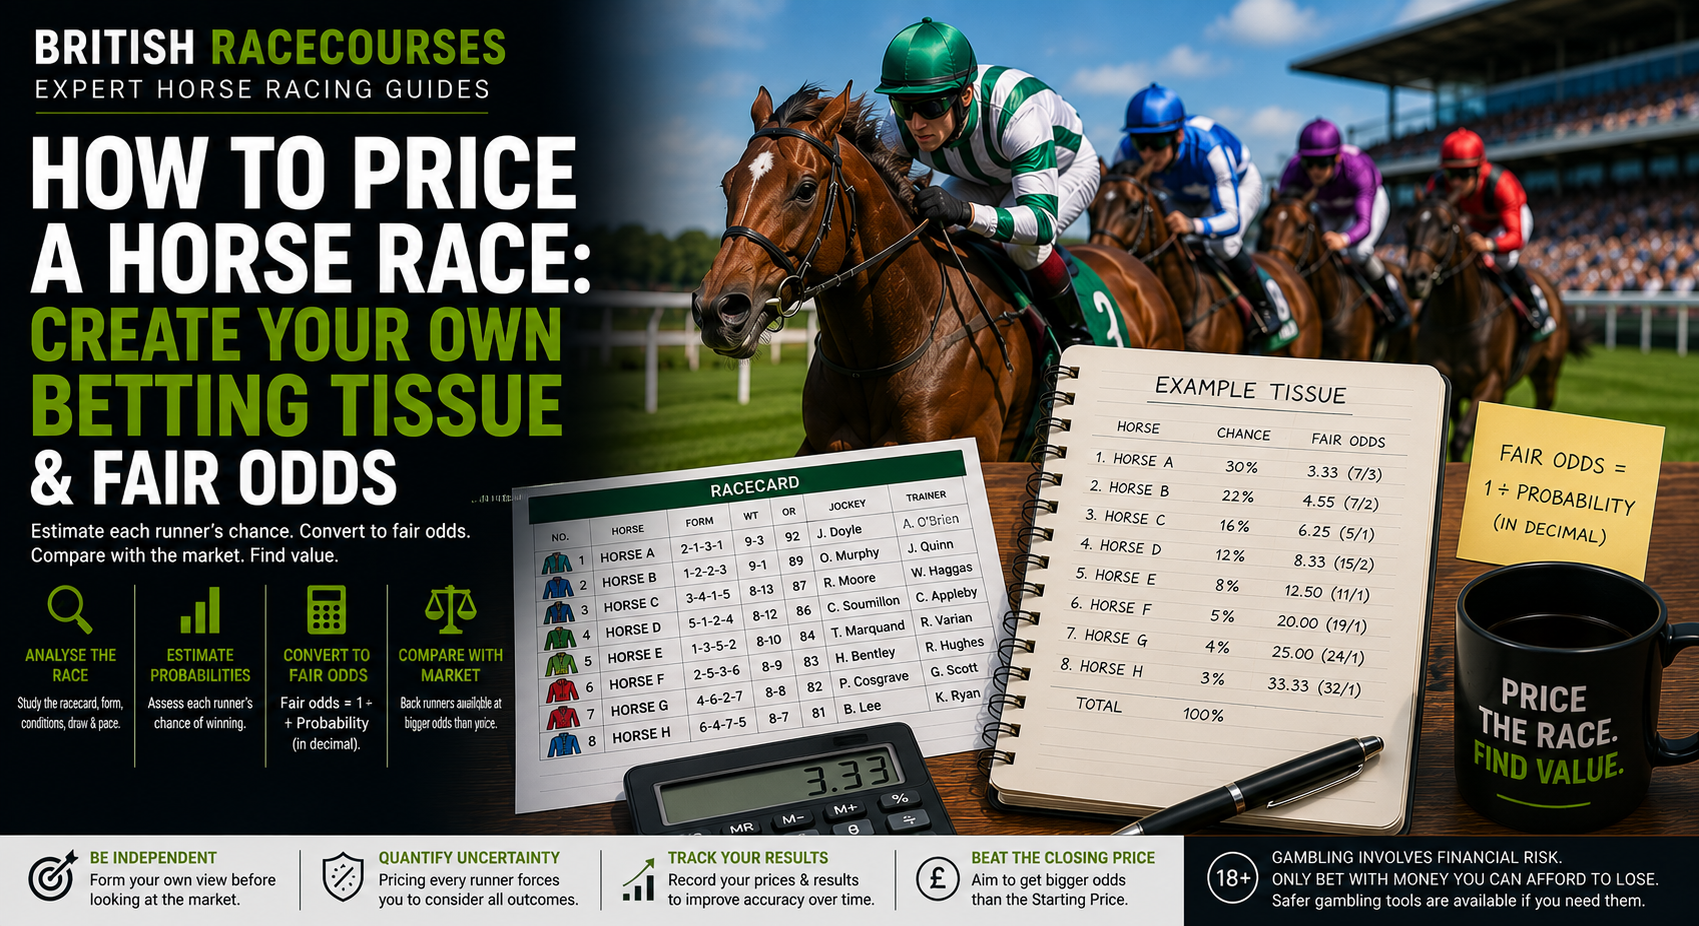
Pricing a horse race means estimating each runner’s chance of winning and converting those probabilities into your own set of betting odds.
This set of prices is traditionally known as a tissue.
Creating your own tissue is one of the biggest steps a racing bettor can take from simply trying to pick winners towards thinking seriously about betting value.
Instead of asking:
Which horse do I think will win?
you begin asking:
What chance does each horse have of winning, and what price would I need before backing it?
That distinction matters.
You might believe the favourite is the most likely winner but calculate that it should be 3/1 rather than the 6/4 being offered.
You might think another horse has only a 15% chance of winning but find bookmakers offering 10/1.
The favourite is still more likely to win.
The 10/1 horse could nevertheless represent the better bet.
This guide explains how to price a horse race from scratch, calculate fair odds, build a tissue and compare your prices with the betting market.
If you have not already done so, read our How to Find Value Bets in Horse Racing guide alongside this page.
What Does Pricing a Horse Race Mean?
Pricing a race means assigning a probability to the chance of each horse winning.
Those probabilities can then be converted into betting odds.
Imagine a four-runner race.
After analysing it, you estimate:
| Horse | Your Winning Chance | Your Fair Decimal Odds |
|---|---|---|
| Horse A | 40% | 2.50 |
| Horse B | 30% | 3.33 |
| Horse C | 20% | 5.00 |
| Horse D | 10% | 10.00 |
| Total | 100% |
You have now created a very simple betting tissue.
If bookmakers subsequently offer:
Horse A: 6/5
Horse B: 4/1
Horse C: 7/2
Horse D: 8/1
you immediately have something useful to compare against.
Your analysis suggests Horse B has a 30% chance of winning.
The available 4/1 price implies a probability of 20%.
That discrepancy deserves investigation.
What Is a Betting Tissue?
A betting tissue is your own estimated set of prices for a race or event.
Traditionally, odds compilers created tissues before bookmaker markets were formed.
A bettor can use the same basic principle.
You analyse the runners.
You estimate their probabilities.
You convert those probabilities into prices.
Then you compare your tissue with the actual market.
The objective is not to predict exactly what bookmakers will offer.
It is to establish what you believe the runners are worth.
Why Create Your Own Horse Racing Odds?
Looking at bookmaker odds first can influence your judgement.
Imagine you see:
Horse A: 6/4 favourite
before studying the race.
Without realising it, you may begin searching for reasons why Horse A deserves to be favourite.
This is known as anchoring.
Creating your own view first reduces that influence.
You might independently conclude Horse A should actually be:
3/1
Now the bookmaker’s 6/4 looks very different.
Alternatively, you might price it:
Evens
In that case, 6/4 could potentially look attractive.
The horse has not changed.
Your assessment of the price has.
Understanding the relationship between probability and price is fundamental to finding value bets in horse racing.
Step 1: Understand the Race Before Pricing the Horses
Do not start assigning odds immediately.
First establish what kind of race you are analysing.
Check:
- race type
- class
- distance
- going
- number of runners
- age restrictions
- handicap conditions
- course configuration
- draw where applicable
The same horse can have completely different winning chances under different conditions.
A strong seven-furlong horse does not automatically deserve the same probability over a mile and a quarter.
A proven fast-ground performer may deserve a different assessment on heavy ground.
Context comes first.
Our How to Analyse a Horse Race Like a Professional guide provides a complete race-analysis framework.
Step 2: Read the Racecard
Next, build a basic picture of every runner.
A horse racing racecard can provide information including:
- recent form
- age
- weight
- Official Rating
- draw
- trainer
- jockey
- headgear
- course form
- distance form
- days since last run
Do not try to price the race from one statistic.
Your probability should reflect the complete case for and against each runner.
If some of the abbreviations or terminology are unfamiliar, our Horse Racing Terms Explained guide provides a useful reference.
Step 3: Assess Recent Form
Start with what each horse has actually achieved.
But do not simply read finishing positions.
A form sequence of:
2-3-1
looks stronger than:
6-5-4
but the numbers do not tell you:
- strength of opposition
- race class
- ground
- distance
- pace
- draw
- trouble in running
- winning margins
The sixth-placed horse may have produced the stronger underlying performance.
Study our Horse Racing Form guide if you need to go deeper into interpreting previous runs.
Look Beyond the Finishing Position
Suppose Horse A finished second last time.
Horse B finished sixth.
At first glance, Horse A appears to have the stronger form.
But Horse B may have:
- raced from a poor draw
- travelled wide
- encountered traffic
- raced against stronger opposition
- been unsuited by the ground
- finished strongly from an impossible position
Horse A may have enjoyed an uncontested lead in a weaker race.
If the market concentrates too heavily on the finishing positions, your deeper analysis can produce a different probability.
That is exactly what pricing a race is designed to uncover.
Step 4: Compare Ability
Now establish the underlying ability of each horse.
Useful indicators include:
- Official Ratings
- speed figures
- previous performance levels
- handicap marks
- quality of races contested
Ratings can help establish an initial hierarchy.
But they should not become your tissue automatically.
A horse with the highest rating is not necessarily the horse with the highest chance of winning today.
Conditions matter.
Understand Official Ratings
Official Ratings become particularly important in handicaps.
The rating represents the handicapper’s assessment of the horse’s ability and determines the weight it carries relative to its rivals.
Our How Racehorse Handicap Ratings Work guide explains the system in detail.
Your job as a bettor is often to decide whether the official assessment accurately reflects the horse’s current ability.
Use Speed Ratings
Speed figures provide another way of comparing performances.
Rather than focusing purely on finishing position, they attempt to quantify how quickly a horse performed after accounting for relevant circumstances.
British Racecourses has a dedicated Top Speed Ratings resource.
A strong speed figure does not guarantee a horse will reproduce the performance.
But it can help identify runners whose underlying ability is stronger than a basic reading of recent form suggests.
Step 5: Assess Today’s Going
Ask whether today’s ground improves or reduces each runner’s chance.
You might rate a horse highly on good ground but considerably lower it on heavy.
Look for evidence.
Has the horse:
- won on the surface?
- run well without winning?
- repeatedly struggled?
- never encountered it?
No previous run does not automatically mean the horse cannot handle the conditions.
Pedigree and running style can provide additional clues.
Read What Does the Going Mean in Horse Racing? for a complete explanation.
Do Not Treat All Ground Descriptions as Identical
Even the same official going description can produce different racing conditions.
Consider:
- recent rainfall
- drainage
- course configuration
- rail movements
- weather during racing
- where the fastest ground is situated
The effect can also vary according to distance.
A horse’s ability to handle soft ground over five furlongs does not automatically prove it wants testing conditions over a mile and a half.
Step 6: Assess the Distance
Does the horse genuinely want today’s trip?
Look beyond whether it has previously won at the distance.
Ask:
- How did it finish?
- Was it weakening?
- Was it staying on?
- Is it stepping up?
- Is it dropping back?
- What does its pedigree suggest?
- How is today’s race likely to be run?
A horse can have winning form over a distance without it being optimal.
Likewise, a horse trying a new distance may improve significantly.
Distance changes should therefore influence the probability you assign.
Step 7: Consider the Course
British racecourses differ enormously.
A horse can be suited by:
- tight turns
- long straights
- uphill finishes
- flat tracks
- undulations
- left-handed circuits
- right-handed circuits
This is where the phrase horses for courses comes from.
Course form should not automatically dominate your pricing, but it can change your confidence in a runner.
Our individual British Racecourse Guides provide detailed information about the characteristics of different tracks.
Step 8: Analyse the Draw
In relevant Flat races, determine whether stall position changes a horse’s chance.
Do not simply apply a rule such as:
Low = good
or:
High = bad
Draw effects depend on:
- racecourse
- distance
- field size
- ground
- stalls position
- early pace
Use our Horse Racing Draw Explained guide when assessing this part of your tissue.
Draw Can Change a Horse’s Fair Price
Suppose you initially give a horse a:
20% chance
before the draw.
The horse subsequently receives an extremely favourable stall over a course and distance where position matters.
You might increase your estimate to:
23%
That changes your fair price from:
4/1
to approximately:
10/3
Small changes in probability can create meaningful changes in fair odds.
Step 9: Build a Pace Map
Now estimate where every runner is likely to race.
Classify them broadly as:
Leader
Prominent
Midfield
Held up
Suppose your race contains one habitual front-runner and seven horses that prefer to settle behind.
The leader may get an uncontested advantage.
That should potentially increase its estimated probability.
Now imagine five habitual front-runners.
A strong early battle becomes much more likely.
That can reduce the chances of those runners and increase the prospects of horses ridden patiently.
Our Horse Racing Pace Maps Explained guide shows you how to build one.
Step 10: Consider Pace Bias
Course configuration can magnify race shape.
Some tracks and distances favour horses that race prominently.
Others give hold-up horses more opportunity.
Ground can alter this further.
That means:
Pace + course + draw
should often be analysed together.
Read Horse Racing Pace Bias Explained for the complete explanation.
Step 11: Consider Trainer Form
Stable form can influence the probability you assign.
If a trainer’s runners are consistently:
- travelling strongly
- finishing races well
- performing above expectations
that can provide additional confidence.
Conversely, a prolonged spell of poor stable performance may deserve consideration.
British Racecourses tracks In-Form Trainers as another analytical input.
Do not automatically back every runner from an in-form stable.
Trainer form should adjust your assessment rather than replace it.
Step 12: Consider the Jockey
Jockey bookings can also matter.
Look at:
- familiarity with the horse
- course experience
- riding style
- recent form
- claiming allowance
- tactical suitability
A rider particularly well suited to a front-running horse around a tactical course may deserve more consideration than a simple jockey win percentage suggests.
Again, translate the information into probability rather than treating it as a standalone betting system.
Step 13: Identify the Serious Contenders
You should now have a clearer hierarchy.
For example:
Tier 1: Strong winning chances
Horse A
Horse B
Tier 2: Realistic contenders
Horse C
Horse D
Horse E
Tier 3: Need improvement or favourable circumstances
Horse F
Horse G
Tier 4: Very difficult to fancy
Horse H
This makes assigning probabilities easier than trying to choose exact percentages immediately.
Step 14: Assign Your Probabilities
Now estimate each horse’s chance.
Imagine an eight-runner race:
| Horse | Estimated Chance |
|---|---|
| Horse A | 30% |
| Horse B | 22% |
| Horse C | 16% |
| Horse D | 12% |
| Horse E | 8% |
| Horse F | 5% |
| Horse G | 4% |
| Horse H | 3% |
| Total | 100% |
Your probabilities should total 100% when creating fair win odds for mutually exclusive outcomes.
This is important.
If they total 130%, you have effectively built a margin into your own prices.
Step 15: Convert Probability Into Fair Odds
The calculation is:
Fair Decimal Odds = 1 ÷ Probability
Use the probability as a decimal.
For Horse A:
30% = 0.30
1 ÷ 0.30 = 3.33
For Horse B:
22% = 0.22
1 ÷ 0.22 = 4.55
For Horse C:
16% = 0.16
1 ÷ 0.16 = 6.25
Your tissue becomes:
| Horse | Chance | Fair Decimal Price |
|---|---|---|
| Horse A | 30% | 3.33 |
| Horse B | 22% | 4.55 |
| Horse C | 16% | 6.25 |
| Horse D | 12% | 8.33 |
| Horse E | 8% | 12.50 |
| Horse F | 5% | 20.00 |
| Horse G | 4% | 25.00 |
| Horse H | 3% | 33.33 |
You now have your own market.
Quick Horse Racing Fair Odds Table
These probability and price relationships are useful to remember:
| Probability | Fair Decimal Odds | Approx. Fractional Odds |
|---|---|---|
| 50% | 2.00 | Evens |
| 40% | 2.50 | 6/4 |
| 33.3% | 3.00 | 2/1 |
| 25% | 4.00 | 3/1 |
| 20% | 5.00 | 4/1 |
| 16.7% | 6.00 | 5/1 |
| 12.5% | 8.00 | 7/1 |
| 10% | 10.00 | 9/1 |
| 5% | 20.00 | 19/1 |
| 2% | 50.00 | 49/1 |
Our Betting Odds Explained guide covers the relationship between fractional, decimal and American odds in more detail.
Step 16: Compare Your Tissue With the Market
Only now do we get to the bookmaker prices.
Imagine:
| Horse | Your Fair Odds | Best Available Odds |
|---|---|---|
| Horse A | 3.33 | 2.75 |
| Horse B | 4.55 | 6.00 |
| Horse C | 6.25 | 5.50 |
| Horse D | 8.33 | 11.00 |
| Horse E | 12.50 | 10.00 |
| Horse F | 20.00 | 17.00 |
| Horse G | 25.00 | 34.00 |
| Horse H | 33.33 | 26.00 |
Now the race looks completely different.
Horse A might be your most likely winner.
But the bookmaker’s price is shorter than your fair price.
You therefore may not want to back it.
Horse B is available at 6.00 when you believe 4.55 is fair.
Horse D is available at 11.00 against your 8.33.
Horse G is 34.00 against your 25.00.
Those discrepancies become candidates for further investigation.
Why the Most Likely Winner Is Not Always the Best Bet
This is one of the most important lessons in racing betting.
Suppose:
Horse A
Your estimated chance: 40%
Fair price: 6/4
Available price: 4/5
Horse B
Your estimated chance: 20%
Fair price: 4/1
Available price: 7/1
Horse A is twice as likely to win according to your analysis.
But you believe the bookmaker is offering a poor price about Horse A and a potentially attractive price about Horse B.
That is the difference between:
selecting winners
and:
betting at value prices.
Do Not Automatically Bet Every Difference
Your tissue is an opinion.
It is not the truth.
If you price a horse at:
5/1
and bookmakers offer:
11/2
the difference is small.
Your probability estimate could easily be slightly wrong.
Many bettors therefore require a margin of safety.
For example, if you price a horse at 5/1, you might decide you only become interested at:
13/2 or bigger.
Your exact threshold is a personal decision.
The principle is more important.
Allow for the fact that your estimates contain error.
What If Your Price Is Completely Different From the Market?
Stop and investigate.
Suppose you price a horse at:
4/1
and bookmakers offer:
16/1.
You might have discovered outstanding value.
But first ask:
What have I missed?
Recheck:
- recent form
- going
- distance
- draw
- handicap mark
- jockey
- trainer
- pace
- equipment
- race conditions
The market can be wrong.
So can you.
A huge disagreement deserves more scrutiny, not immediate excitement.
Do Not Change Your Tissue Just Because the Market Disagrees
This is difficult.
You price a horse at 5/1.
The market says 12/1.
You begin thinking:
I must be wrong.
Perhaps you are.
But blindly changing your assessment to 10/1 simply because bookmakers disagree defeats the purpose of creating your own prices.
Instead, investigate the discrepancy.
If you discover information you overlooked, change your price.
If your analysis still stands, retain your opinion.
What Is a 100% Book?
Your fair probabilities should total 100%.
This represents a theoretical market with no bookmaker margin.
For example:
25% + 25% + 20% + 15% + 10% + 5%
= 100%
Bookmaker markets normally exceed 100%.
That excess is commonly known as the overround.
What Is Bookmaker Overround?
Bookmaker prices contain a theoretical margin.
Imagine a simple two-outcome market where both outcomes are priced at 10/11.
Each price implies a probability greater than 50%.
Add the probabilities together and the total exceeds 100%.
The amount above 100% is the overround.
Horse racing markets are more complicated because there are many runners and prices change continuously.
The principle remains the same.
This is one reason you should not simply assume bookmaker prices represent each horse’s exact true probability.
Your Tissue Should Not Include a Bookmaker Margin
If you are calculating genuine fair prices, start with:
100%.
Do not deliberately build a bookmaker margin into your tissue.
You want to answer:
What do I think the true odds are?
You can then compare those fair odds against the actual betting market.
Avoid False Precision
Newcomers often become obsessed with producing extremely precise percentages.
You do not genuinely know that a horse has exactly:
17.43%
chance of winning.
You are estimating.
Initially, it can be more sensible to think in broader terms:
- approximately 40%
- approximately 30%
- approximately 20%
- approximately 10%
As your process develops and you collect more data, your pricing can become more refined.
Price the Race, Not Just Your Selection
Suppose you love Horse A.
You decide:
Horse A has a 40% chance.
But what about the other 60%?
If you cannot reasonably distribute that probability among the opposition, you may not understand the race well enough.
Pricing every runner forces you to consider:
What has to beat my selection?
That can expose weaknesses in your original opinion.
Why Pricing Every Runner Is Powerful
Imagine you initially think Horse A is a strong favourite.
When you analyse the opposition, you realise:
Horse B has strong form.
Horse C gets ideal ground.
Horse D has a perfect pace setup.
Horse E looks well handicapped.
Suddenly allocating 50% of the total probability to Horse A becomes difficult.
Your tissue forces you to quantify uncertainty.
That is exactly what makes it useful.
Price Handicap Races Carefully
Handicaps are deliberately designed to make races competitive.
The highest-rated horses carry more weight, with the intention of reducing their natural ability advantage.
Look particularly for runners that may be:
- ahead of the handicapper
- dropping to a workable mark
- improving faster than their rating
- returning to suitable conditions
- better than recent finishing positions suggest
Our Guide to Horse Racing Handicapping explains how the system works.
Look for Horses Ahead of the Handicapper
Imagine a horse wins from an Official Rating of 75.
It wins comfortably enough to suggest it performed more like an 82-rated horse.
Its next mark rises to 79.
If your assessment is correct, it could still have several pounds in hand.
That should influence the probability you assign.
However, never assume every recent winner remains well handicapped.
Ask whether the previous performance genuinely justifies the conclusion.
Price Unexposed Horses Carefully
Young and lightly raced horses create additional uncertainty.
A horse with 30 starts gives you considerable evidence.
A two-year-old making its third start does not.
This is where:
- pedigree
- trainer record
- previous sectionals
- visual impression
- expected improvement
can become more important.
But uncertainty should be reflected in your confidence.
Do not pretend you know more than the available evidence allows.
Use Pedigree When Evidence Is Limited
Pedigree becomes particularly useful when a horse:
- tries a new distance
- encounters different ground
- is lightly raced
- is making its debut
- switches surface
Breeding cannot tell you exactly how a horse will perform.
It can help estimate whether improvement or deterioration under new conditions is plausible.
Watch Race Replays
Racecards tell you what happened.
Race replays can help explain how it happened.
Look for horses that:
- travelled strongly
- were denied a run
- raced wide
- started slowly
- used excessive energy early
- finished strongly
- were poorly positioned
- jumped badly
- encountered traffic
The objective is not to invent excuses for every losing horse.
It is to identify information that a finishing position alone cannot show.
Use Sectional Times
Sectional timing breaks a race into individual segments.
It can help identify horses that:
- finished unusually quickly
- went too fast early
- were disadvantaged by race shape
- produced more ability than the final result suggests
British Racecourses tracks Fast Finishers, which can highlight horses that produced notable finishing efforts.
Sectionals become particularly useful when combined with pace analysis.
Compare Your Tissue With Market Movers
Market movements can provide another reference point after you have created your own prices.
A horse you rate at 5/1 might initially be available at 10/1 and subsequently shorten to 6/1.
Another may drift from 5/1 to 10/1.
Neither move proves your original assessment was correct or incorrect.
But comparing your tissue against later market behaviour can reveal useful patterns.
British Racecourses tracks Best Backed Horses Today for readers interested in current market movers.
Keep Your Old Tissues
Do not throw your prices away after the race.
Save:
- your probability
- your fair odds
- bookmaker price
- price taken
- Starting Price
- result
Over time you can ask:
Am I actually good at pricing races?
That question is far more useful than remembering your best winners.
Compare Your Price With the Starting Price
Suppose over 200 bets you regularly take:
8/1
about horses that eventually start:
5/1.
That can be useful evidence that you are identifying bigger prices than the later market.
If you consistently take:
5/1
about horses that start:
10/1
investigate your process.
This does not prove every market move is correct.
Large samples can nevertheless reveal patterns.
What Is Closing Line Value?
Comparing the price you take against a later or closing market price is commonly known as assessing closing line value.
For example:
You take:
10/1
The horse starts:
6/1
You have beaten the closing price.
If this happens repeatedly across hundreds of selections, it can be evidence that your pricing process is identifying market differences effectively.
It does not guarantee profitability.
But it gives you something more meaningful to evaluate than individual winners and losers.
Measure Your Probability Accuracy
You can go further by grouping horses according to the probability you assigned.
For example:
Horses rated 50%
Do approximately half eventually win?
Horses rated 25%
Do roughly one quarter win?
Horses rated 10%
Do approximately one in ten win?
This is known as calibration.
If horses you repeatedly assess at 25% win only 10% of the time across a sufficiently large sample, your probabilities may be too optimistic.
Do Not Judge Your Tissue on One Race
Suppose you price:
Horse A: 50%
Horse B: 25%
Horse C: 15%
Others: 10%
Horse C wins.
That does not prove your prices were wrong.
A 15% chance should win sometimes.
Probability is not prediction.
You need a meaningful sample before drawing strong conclusions about your pricing ability.
Creating a Tissue for Each-Way Betting
Win probability is only the starting point for each-way bets.
You also need to assess the horse’s chance of placing.
That becomes more complicated because:
- number of places varies
- each-way fractions vary
- field size matters
- bookmaker promotions differ
This is why you should compare the complete each-way proposition rather than simply the win odds.
Compare Bookmakers After Creating Your Tissue
Once you know your target price, shop around.
Suppose your tissue says:
Horse A: 5/1
You find:
Bookmaker A: 7/2
Bookmaker B: 9/2
Bookmaker C: 6/1
Bookmaker D: 13/2
Your opinion of the horse has not changed.
But your potential betting opportunity has.
This is why our How to Compare Horse Racing Bookmakers guide should be used alongside this page.
Multiple Bookmaker Accounts Make Price Shopping Easier
If you have legitimate accounts with several suitable bookmakers, you have more prices available to compare.
You do not need dozens.
You need enough choice to avoid accepting a materially worse price unnecessarily.
Our Multiple Bookmaker Accounts guide explains the practical considerations.
For the operators themselves, use our Best Horse Racing Betting Sites comparison.
Consider Best Odds Guaranteed
If an eligible bet qualifies for Best Odds Guaranteed, the bookmaker’s terms may affect which available price you prefer.
Imagine:
Bookmaker A: 6/1 with qualifying BOG
Bookmaker B: 13/2 without BOG
Bookmaker B offers the bigger initial price.
Bookmaker A could become more attractive if the horse subsequently drifts significantly and the wager qualifies for BOG.
Again:
Compare the whole bet, not just one number.
Use Betting Exchanges as Another Price Reference
Traditional bookmakers are not your only comparison.
A betting exchange allows customers to bet against other customers.
Exchange prices can sometimes differ considerably from bookmaker prices.
Remember to account for:
- commission
- liquidity
- available stake
- changing prices
The exchange market can also provide another useful reference when assessing whether your tissue differs substantially from wider market opinion.
Simple Horse Race Pricing Template
Use this table when analysing a race:
| Horse | Form | Going | Distance | Draw/Pace | Rating | Your Chance | Fair Odds | Market Odds |
|---|---|---|---|---|---|---|---|---|
| A | + | + | + | Neutral | Strong | 30% | 3.33 | |
| B | + | Neutral | + | + | Strong | 22% | 4.55 | |
| C | Neutral | + | + | + | Average | 16% | 6.25 | |
| D | + | – | Neutral | + | Strong | 12% | 8.33 |
Do not turn the pluses and minuses into a rigid mechanical system.
They are there to organise your thinking.
A Complete Horse Race Pricing Process
The full process can be reduced to ten stages:
1. Understand the race
Identify the race type, class, distance, going and field size.
2. Analyse the runners
Study form, ratings, course suitability and distance.
3. Analyse the draw
Determine whether stall position matters.
4. Analyse pace
Create an expected race shape.
5. Consider connections
Assess trainer and jockey factors.
6. Rank the contenders
Separate strong contenders from outsiders.
7. Assign probabilities
Estimate each horse’s chance of winning.
8. Check the total
Your fair win probabilities should total 100%.
9. Convert probabilities into odds
Create your tissue.
10. Compare with the market
Look for meaningful differences between your prices and those available.
That gives you a repeatable race-pricing process rather than relying on instinct alone.
Horse Race Pricing Checklist
Before producing your tissue, ask:
The Race
☐ What type of race is it?
☐ What is the class?
☐ What is the distance?
☐ What is the going?
☐ How competitive is it?
The Horse
☐ What has it achieved?
☐ How strong is its form?
☐ Does today’s distance suit?
☐ Does today’s ground suit?
☐ Is its handicap mark favourable?
Race Shape
☐ Is the draw important?
☐ Where will the horse race?
☐ How much early pace is present?
☐ Who benefits from that pace?
Connections
☐ Is the trainer in form?
☐ Does the jockey booking matter?
Price
☐ What percentage chance do I give it?
☐ What are my fair odds?
☐ What price is available?
☐ Is the difference meaningful?
☐ Have I compared bookmakers?
If you cannot answer the probability question, you have not finished analysing the bet.
Common Mistakes When Pricing Horse Races
Starting With Bookmaker Odds
This can anchor your judgement before you have formed an independent opinion.
Pricing Only the Horse You Fancy
You need to understand the opposition.
Probabilities Not Adding to 100%
A fair win market should total 100%.
False Precision
Your 17.82% estimate is still an estimate.
Overreacting to Recent Finishing Positions
Analyse the performance rather than just the result.
Ignoring Race Shape
Pace can change winning probabilities.
Ignoring the Draw
At some courses and distances, stall position can materially affect a horse’s chance.
Ignoring Uncertainty
Lightly raced horses are harder to price confidently.
Automatically Changing Your Opinion When the Market Disagrees
Investigate the difference first.
Assuming a Big Price Means Value
50/1 can still be too short.
Forcing a Bet
Sometimes your tissue and the bookmaker market are broadly similar.
That means:
no obvious value.
There is nothing wrong with not betting.
Frequently Asked Questions
What does pricing a horse race mean?
Pricing a horse race means estimating each runner’s probability of winning and converting those probabilities into fair odds.
What is a betting tissue?
A betting tissue is your own set of estimated prices for the runners in a race.
Why is it called a tissue?
The term has long been used in bookmaking and betting to describe a preliminary set of prices created before or independently of the market.
How do I calculate fair odds?
Divide one by your estimated probability expressed as a decimal.
What odds represent a 50% chance?
Decimal odds of 2.00, equivalent to Evens.
What odds represent a 25% chance?
Decimal odds of 4.00, equivalent to 3/1.
What odds represent a 20% chance?
Decimal odds of 5.00, equivalent to 4/1.
What odds represent a 10% chance?
Decimal odds of 10.00, equivalent to 9/1.
Should my probabilities add to 100%?
Yes, for a fair win-only market where one of the listed runners must win.
What is overround?
Overround is the amount by which the combined implied probabilities in a bookmaker’s market exceed 100%.
Should I look at bookmaker odds before creating my tissue?
Many bettors prefer forming an independent view first to reduce the risk of anchoring their assessment to existing market prices.
Do I have to price every horse?
Doing so is useful because it forces you to assess the complete race rather than only your preferred selection.
How accurate does my tissue need to be?
No tissue will be perfectly accurate. The objective is to develop probability estimates that become useful over repeated races.
What happens if the market completely disagrees with me?
Recheck your analysis. You may have missed something, or your independent assessment may have identified a genuine disagreement with the market.
Should I bet whenever the bookmaker price is bigger than mine?
Not necessarily. Your estimate contains uncertainty, so requiring a meaningful margin can protect against small errors.
Can I use ratings to create odds?
Ratings can provide a useful starting point, but winning probability also depends on race conditions, pace, draw, going, distance and other factors.
Can I price handicap races?
Yes. Handicaps can be particularly interesting because the weights are designed to reduce differences in ability.
Does pace affect fair odds?
Yes. A favourable or unfavourable expected race shape can alter a horse’s winning probability.
Does the draw affect fair odds?
It can, particularly over certain Flat racing courses and distances.
Should I keep my old tissues?
Yes. Recording your prices allows you to evaluate their accuracy and compare your assessments with later market prices.
What is closing line value?
It is the comparison between the price you obtained and the later or closing market price.
Does beating the Starting Price mean I will make money?
No. However, repeatedly obtaining bigger prices than the later market across a large sample can provide useful information about your pricing process.
Does creating a tissue guarantee profit?
No. Your probability assessments can be wrong and horse racing remains uncertain.
Summary
Learning how to price a horse race changes the way you analyse betting opportunities.
Instead of asking only:
Who will win?
you ask:
What chance does every horse have of winning?
You then convert those probabilities into your own fair odds.
The process is:
Analyse the race
↓
Assess every runner
↓
Study form, ratings and conditions
↓
Analyse draw and pace
↓
Estimate probabilities
↓
Make sure they total 100%
↓
Convert probabilities into fair odds
↓
Compare your tissue with bookmaker prices
↓
Investigate meaningful differences
↓
Bet only when the available proposition justifies it
Your tissue will never be perfect.
It does not need to be.
Its purpose is to stop bookmaker prices from being the starting point for every opinion you form.
If you calculate that a horse should be 3/1 and the best available price is 6/4, you can leave it alone even if you think it is the most likely winner.
If you calculate another horse should be 5/1 and can obtain 8/1, you have identified a potential value opportunity worth investigating.
Continue with How to Find Value Bets in Horse Racing to understand how your fair prices become betting decisions.
Use How to Compare Horse Racing Bookmakers to find the strongest available price.
And use How to Analyse a Horse Race Like a Professional to improve the analysis underpinning your probabilities.
The goal is not to predict every winner.
The goal is to become better at deciding what each horse’s chance is worth.
18+. Gambling involves financial risk. Only bet with money you can afford to lose. Safer-gambling and self-exclusion tools are available if you need them.